


Material flux variation and mechanism analysis of different rivers originating from the Tibetan Plateau
-
摘要: 亚洲多条大河源自青藏高原地区, 各流域水资源的变化一方面反映了青藏高原的变化, 另一方面与流域国家间的水资源利用关系密切. 基于1995年和2015年两期土地利用现状遥感监测数据和源自青藏高原的6条主要河流水沙及氮、磷、硅等营养盐通量数据, 尝试分析不同流域河流入海物质通量变化及影响因素. 结果表明: 1995—2015年, 印度河和布拉马普特拉河径流显著减少, 长江入海径流阶段性下降, 恒河增加而黄河和湄公河径流总体变化不大. 长江、黄河和印度河输沙量显著减少(p < 0.05). 营养盐通量方面, 黄河、湄公河溶解无机氮呈上升趋势而长江略有下降. 氮磷通量主要受径流量的影响, 硅酸盐通量主要受输沙影响, 与输沙变化一致. 坝库兴建、土地利用类型变化和农药化肥使用减少了泥沙输送且改变了营养盐输送. 社会经济发展阶段更高的流域, 氮磷总量增加, 输沙减少. 研究河流入海物质通量, 掌握各流域本底数据, 为实现流域水资源调控及建设流域命运共同体提供基础.Abstract: Many large rivers in Asia originate from the Tibetan Plateau. Changes in the rivers reflect not only changes in the Tibetan Plateau itself, but also relate closely to water resource utilization in the respective basin countries. Changes in terrestrial materials entering the sea reveal the impact of human activities on land-sea interactions in the basin. With changes in natural conditions and socio-economics, material flux from the basin has evolved over time. In this resarch, material flux was compared quantitatively by analysis of the water discharge, sediment load, and nutrient volumes for elements such as nitrogen, phosphorus, and silicon in the Yangtze, Yellow, Mekong, Indus, Ganges, and Brahmaputra Rivers. In addition, the mechanism of variation was discussed by comparison of two phases of land use and land cover in 1995 and 2015, which were extracted from remote sensed image mapping. The results revealed that the runoff of the Yangtze, Indus, and Brahmaputra Rivers decreased significantly from 1995 to 2015, but the Ganges increased over the same period. The Mekong River runoff changed slightly and fluctuated year to year. However, the sediment transportation from river to sea in the Yangtze, Yellow, and Indus Rivers reduced substantially at a statistically significant level (p < 0.05). In terms of nutrient element flux, the dissolved inorganic nitrogen (DIN) of the Yellow and Mekong Rivers showed an upward trend and the Yangtze River DIN decreased by about 26.5%. The total phosphorus and silicon flux in the Yangtze and Mekong Rivers did not change much, while the dissolved inorganic phosphorus (DIP) in the Yellow River decreased. The nitrogen and phosphorus flux was mainly affected by runoff, and the silicate flux was influenced by variations in sediment loads. Furthermore, dam construction, usage of pesticides and fertilizers, and changes in land use have changed the proportion of nutrient elements. An increase in industrial activity, agricultural development, and water conservancy facilities, resulted in a higher total nitrogen and phosphorus flux and more significant reduction in sediment loads. Understanding the material flux data of each basin is of great significance for management departments to build basins with common goals and use water resources reasonably and effectively.
-
Key words:
- basin /
- material flux /
- land use change /
- mechanism analysis
-

图 2 源自青藏高原的主要河流1990—2015年径流量和输沙量年际变化
Fig. 2 Interannual variation of runoff and sediment loads of the main rivers in the Tibetan Plateau from 1990 to 2015

图 3 长江、黄河和湄公河入海N、P、Si通量年际变化
Fig. 3 Interannual variation of N, P, and Si flux in the Yangtze, Yellow, and Mekong Rivers
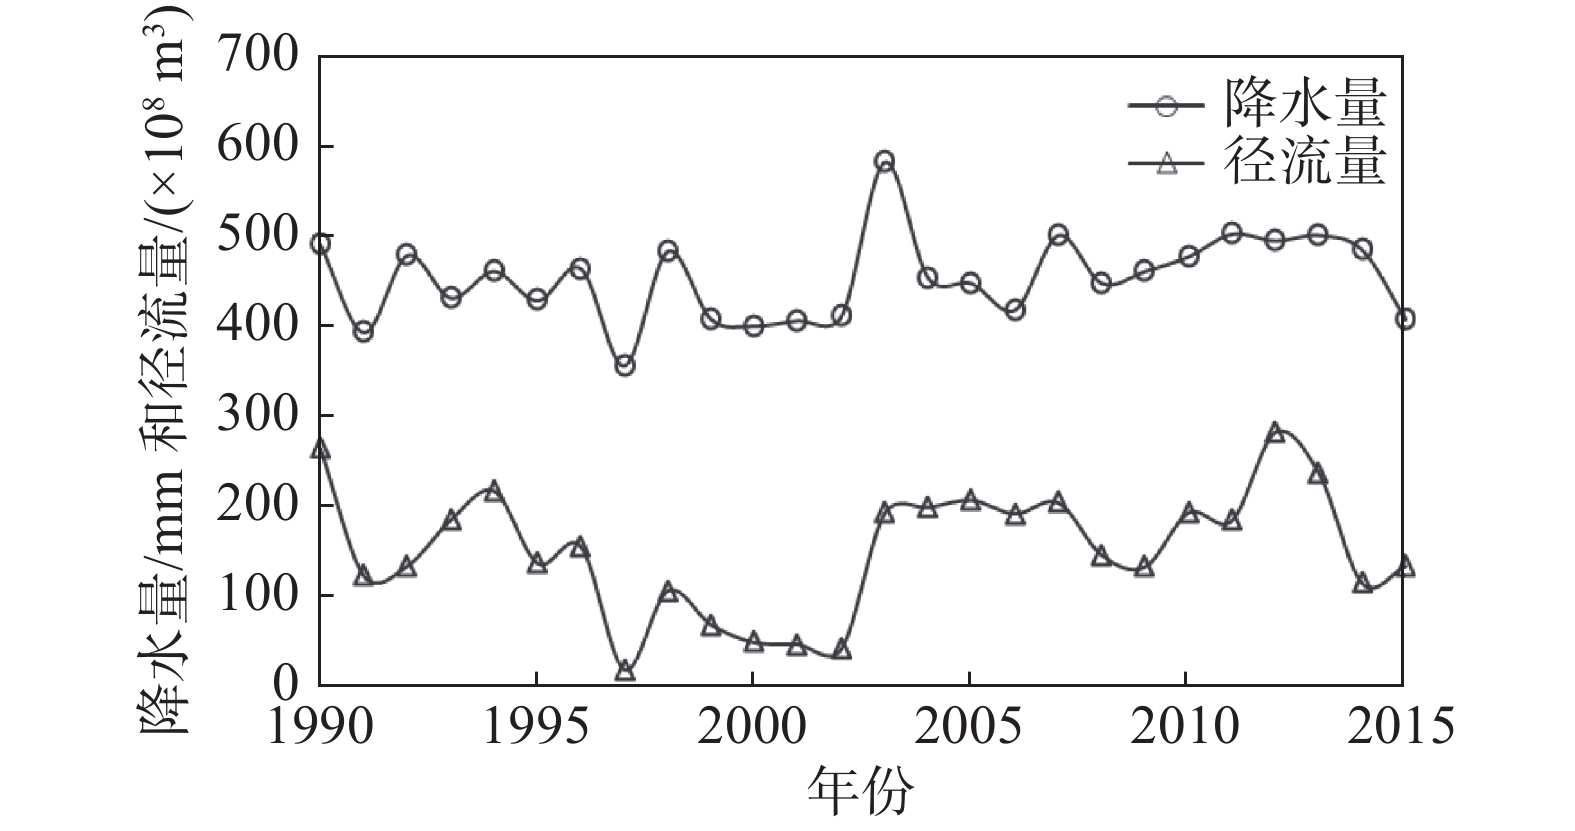
图 4 黄河流域径流量和降水量的变化
Fig. 4 Variation in runoff and precipitation in the Yellow River Basin
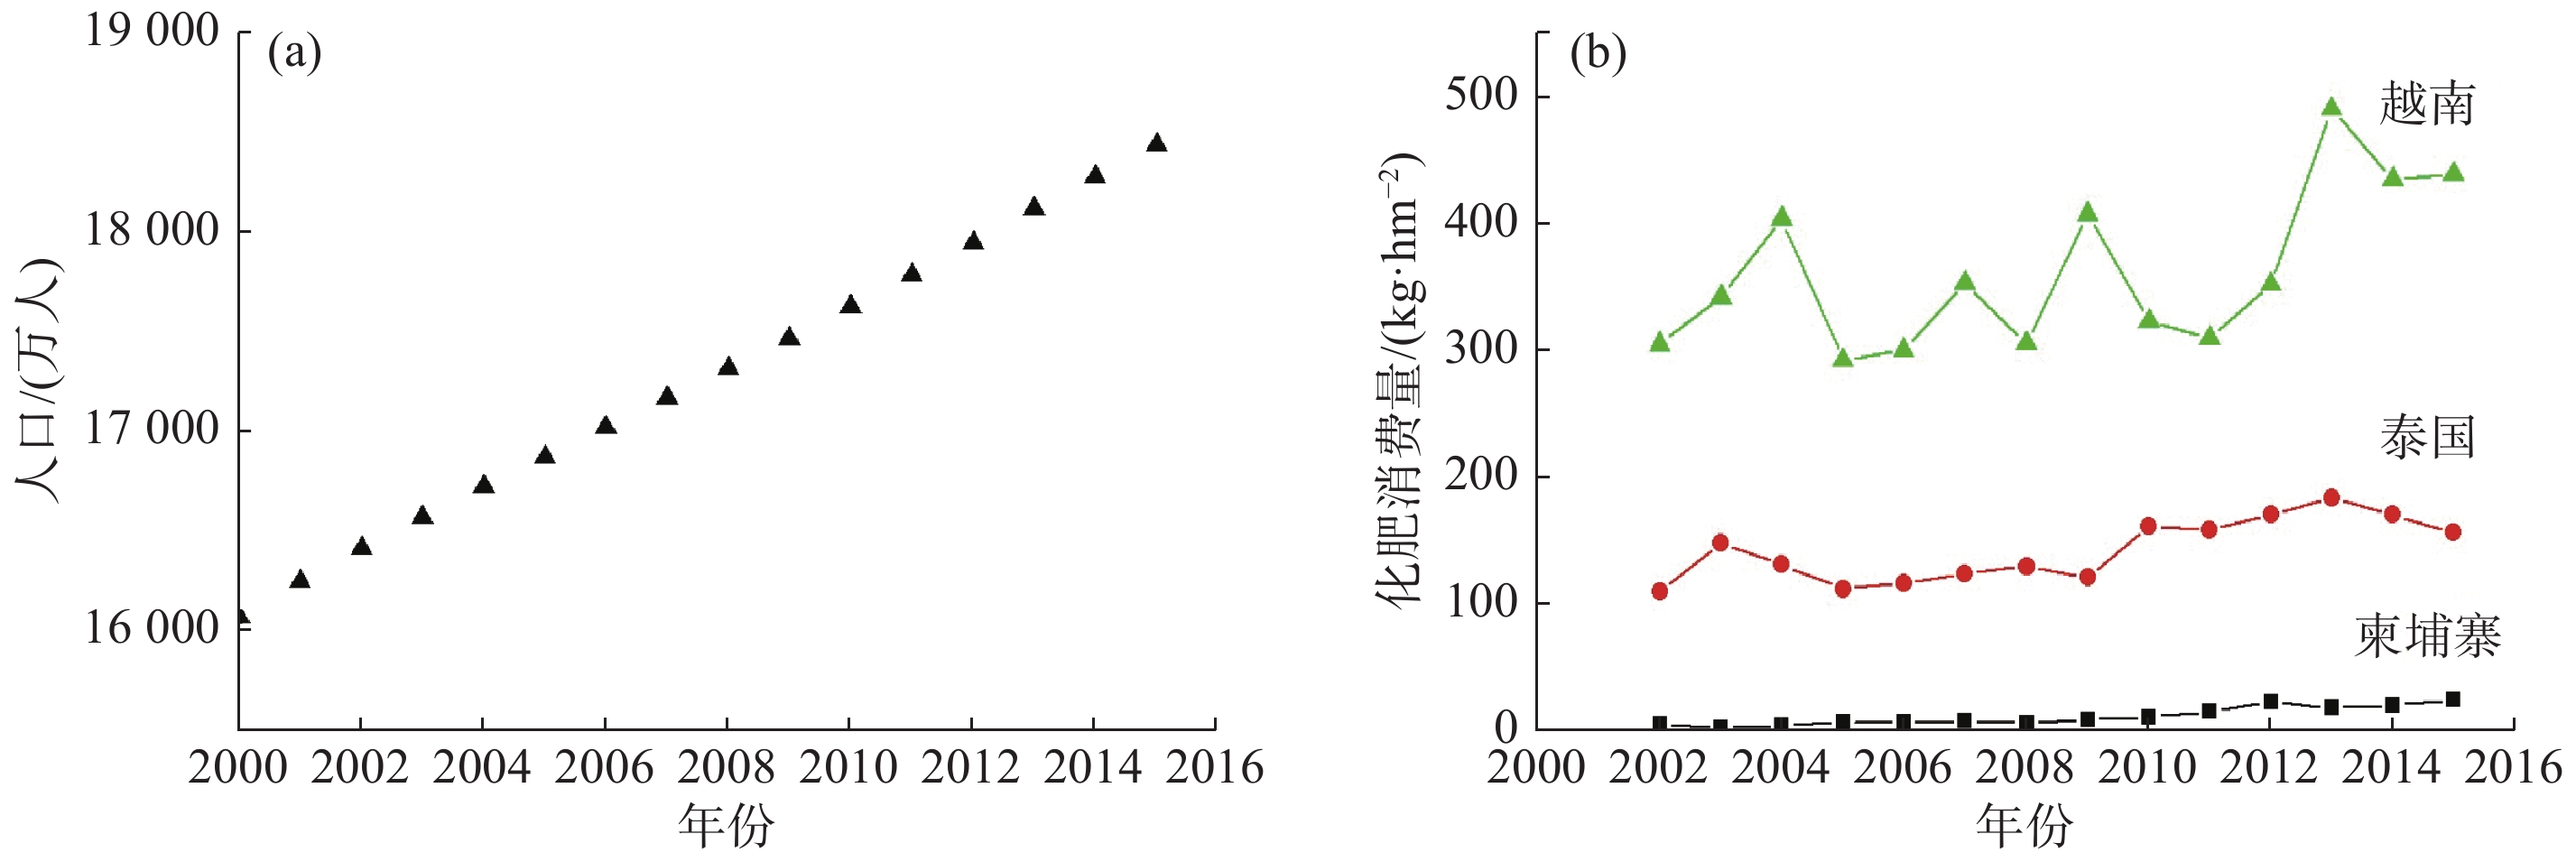
图 5 下湄公河流域国家人口总数(a)和化肥消费量情况(b)
Fig. 5 Population (a) and fertilizer consumption (b) in the Lower Mekong River Basin
表 1 流域基本信息
Tab. 1 Basic information about the basins
河流名称 流域面积/
( × 104 km2)年均径流量/
( × 108 m3)年均输沙量/
( × 108 t)降水量/
mm时间年限 数据来源 长江 180 8 931 3.68 1 049 1951—2015 长江泥沙公报, 2015 黄河 80.8 292.8 6.74 453 1950—2015 黄河泥沙公报, 2015 湄公河 79.6 3 049 0.95 1 540 1962—2013 MRC, 2010 恒河 105.3 3 549 3.16 1 127 1980—2003 Islam, 1999和Jian, 2009 印度河 127.1 665.2 0.72 459 1960—2001 Walling, 2009 布拉马普特拉河 60.9 6 773 7.21 1 569 1980—2003 Islam, 1999和Jian, 2009  下载: 导出CSV
表 2 青藏高原主要河流年径流输沙通量变化趋势Mann-Kendall检验
Tab. 2 Mann-Kendall test table for annual runoff and sediment transport trends of major rivers in the Tibetan Plateau
河流名称 时间序列 年均径流量/
(× 108 m3)年均输沙量/
(× 108 t)径流量 输沙量 Zc 显著水平 Zc 显著水平 恒河 1990—2003 3 549.9 – 1.53 0.1 – – 布拉马普特拉河 1990—2003 6 773 – –1.97 0.1 – – 黄河 1990—2015 152.3 2.26 0.66 > 0.1 –3.04 0.05 长江 1990—2015 8 966 2.35 –1.59 0.1 –4.98 0.05 湄公河 1990—2013 3 091.46 1.01 0.06 > 0.1 – – 印度河 1990—2001 409.6 0.33 –2.4 0.05 –2.06 0.05
下载: 导出CSV
表 3 1995—2015年长江、黄河、湄公河、恒河、印度河和布拉马普特拉河流域土地利用/土地覆被类型面积变化
Tab. 3 Variation of land use/land cover in the Yangtze, Yellow, Mekong, Ganges, Indus, and Brahmaputra River Basins from 1995 to 2015
长江 黄河 湄公河 恒河 布拉马普特拉河 印度河 面积 变化率 面积 变化率 面积 变化率 面积 变化率 面积 变化率 面积 变化率 草地 –11 887.83 –0.66% –14 966.75 –1.85% –991.80 –0.12% 1 473.84 0.14% 2 634.03 0.39% 17 558.46 1.38% 耕地 –11 080.63 –0.62% –2 002.33 –0.25% 19 902.24 2.50% –5 570.10 –0.53% 1 712.43 0.26% –3 359.43 –0.26% 建设用地 16 539.24 0.92% 6 267.68 0.78% 2 136.06 0.27% 5 122.08 0.49% 729.00 0.12% 6 487.38 0.51% 林地 –6 804.11 –0.38% 7 799.96 0.96% –23 272.4 –2.92% –179.64 –0.02% –2 206.53 –0.40% –842.58 –0.07% 水域 5 001.28 0.28% 1 358.84 0.17% 398.79 0.05% 1 103.22 0.10% –450.00 –0.08% 219.96 0.02% 未利用土地 8 231.71 0.46% 1 542.78 0.19% 1 831.59 0.23% –1 949.40 –0.19% –1 778.22 –0.30% –20 063.80 –1.58%
下载: 导出CSV
表 4 6大流域基本社会经济情况
Tab. 4 Social and economic information of the 6 basins
人口总数/(×108 人) 人均GDP/(×104 元) 耕地面积比重/% 建设面积比重/% 坝库容量/km3 发展阶段 长江 4.50 5.43 26.18 2.68 430.47 一 黄河 1.31 2.20 26.93 2.71 120.53 二 湄公河 0.74 1.72 43.84 0.38 104.13 二 印度河 2.67 0.71 40.42 0.59 27.82 三 恒河 5.61 0.97 68.63 0.70 224.01 三 布拉马普特拉河 1.02 0.52 20.55 0.16 6.72 三
下载: 导出CSV
-
[1] 李新艳, 王芳, 杨丽标, 等. 河流输送泥沙和颗粒态生源要素通量研究进展 [J]. 地理科学进展, 2009, 28(4): 558-566. DOI: 10.11820/dlkxjz.2009.04.011. [2] NIXON S W. Coastal marine eutrophication: A definition, social causes, and future concerns [J]. Ophelia, 1995, 41(1): 199-219. DOI: 10.1080/00785236.1995.10422044. [3] PAERL H W. Coastal eutrophication and harmful algal blooms: Importance of atmospheric deposition and groundwater as “new” nitrogen and other nutrient sources [J]. Limnology & Oceanography, 1997, 42(5): 1154-1165. [4] WANG B D, TU J B. Biogeochemistry of nutrient elements in the Changjiang (Yangtze River) Estuary [J]. Marine Science Bulletin, 2005, 7(2): 72-79. [5] 沈焕庭. 长江河口物质通量 [M]. 北京: 海洋出版社, 2001. [6] GEBREMICAEL T G, MOHAMED Y A, BETRIE G D, et al. Trend analysis of runoff and sediment fluxes in the Upper Blue Nile basin: A combined analysis of statistical tests, physically-based models and landuse maps [J]. Journal of Hydrology, 2013, 482(9): 57-68. [7] CUO L, ZHANG Y X, GAO Y H, et al. The impacts of climate change and land cover/use transition on the hydrology in the upper Yellow River Basin, China [J]. Journal of Hydrology, 2013, 502(10): 37-52. [8] IMMERZEEL W W, BEEK L P H V, BIERKENS M F P. Climate change will affect the Asian Water Towers [J]. Science, 2010, 328(5984): 1382-1385. DOI: 10.1126/science.1183188. [9] CHEN Y N, LI W H, DENG H J, et al. Corrigendum: Changes in Central Asia’s Water Tower: Past, Present and Future [J]. Scientific Reports, 2016, 6(1): 35458. DOI: 10.1038/srep35458. [10] 孙静, 贾绍凤, 吕爱峰. 喜马拉雅地区国际河流信息提取与分析 [J]. 南水北调与水利科技, 2011, 9(3): 33-38. [11] 姚檀栋, 刘晓东, 王宁练. 青藏高原地区的气候变化幅度问题 [J]. 科学通报, 2000, 45(1): 98-106. DOI: 10.3321/j.issn:0023-074X.2000.01.021. [12] YAO T, THOMPSON L G, YANG W, et al. Different glacier status with atmospheric circulations in Tibetan Plateau and surroundings [J]. Nature Climate Change, 2012, 2(9): 663-667. DOI: 10.1038/nclimate1580. [13] 唐祥祥, 王茉, 徐柏青. 青藏高原大气和雪冰黑碳的空间分布特征 [J]. 地球科学与环境学报, 2017, 39(5): 695-703. DOI: 10.3969/j.issn.1672-6561.2017.05.007. [14] GAO J, YAO T, MASSONDELMOTTE V, et al. Collapsing glaciers threaten Asia’s water supplies [J]. Nature, 2019, 565(7737): 19-21. DOI: 10.1038/d41586-018-07838-4. [15] TSENDBAZAR N E, DE BRUIN S, FRITZ S, et al. Spatial accuracy assessment and integration of global land cover datasets [J]. Remote Sensing, 2015, 7(12): 15804-15821. DOI: 10.3390/rs71215804. [16] YANG Y, XIAO P, FENG X, et al. Accuracy assessment of seven global land cover datasets over China [J]. ISPRS Journal of Photogrammetry and Remote Sensing, 2017, 125: 156-173. DOI: 10.1016/j.isprsjprs.2017.01.016. [17] 水利部长江水利委员会. 长江泥沙公报 [M]. 武汉: 水利部长江水利委员会, 2015. [18] 水利部黄河水利委员会. 黄河水资源公报 [M]. 郑州: 水利部黄河水利委员会, 2015. [19] JIAN J, WEBSTER P J, HOYOS C D. Large-scale controls on Ganges and Brahmaputra river discharge on intraseasonal and seasonal time-scales [J]. Quarterly Journal of the Royal Meteorological Society, 2009, 135(639): 353-370. DOI: 10.1002/qj.384. [20] WALLING D E. The Impact of Global Change on Erosion and Sediment Transport by Rivers: Current Progress and Future Challenges [M]. Paris: The United Nations Educational, Scientific and Cultural Organization, 2009. [21] MEKONG RIVER COMMISSION. State of the Basin Report 2010 [R]. Mekong River Commission, 2010. [22] WALLING D E. The changing sediment load of the Mekong [J]. Ambio, 2008, 37(3): 150-157. DOI: 10.1579/0044-7447(2008)37[150:TCSLOT]2.0.CO;2. [23] LI S Y, BUSH R T. Rising flux of nutrients (C, N, P and Si) in the lower Mekong River [J]. Journal of Hydrology, 2015, 530: 447-461. DOI: 10.1016/j.jhydrol.2015.10.005. [24] KOEHNKEN L. Discharge Sediment Monitoring Project (DSMP) 2009—2013: Summary & Analysis of Results [R]. Mekong River Commission, 2014. [25] 谭加强. 黄河营养盐及向渤海输送的研究 [D]. 山东 青岛: 中国海洋大学, 2002. [26] 王婷. 2002—2004年及调水调沙期间黄河下游营养盐的变化特征 [D]. 山东 青岛: 中国海洋大学, 2007. [27] 巩瑶. 黄河下游利津站营养盐输送规律及影响因素研究 [D]. 山东 青岛: 中国海洋大学, 2012. [28] 李玲伟. 沉积物-水界面交换和黄河输入对渤海营养盐的影响 [D]. 山东 青岛: 中国海洋大学, 2010. [29] DAI Z J, DU J Z, ZHANG X L, et al. Variation of riverine material loads and environmental consequences on the Changjiang (Yangtze) Estuary in recent decades (1955—2008) [J]. Environmental Science & Technology, 2011, 45(1): 223-227. [30] HAMED K H. Trend detection in hydrologic data: The Mann–Kendall trend test under the scaling hypothesis [J]. Journal of Hydrology, 2008, 349(3/4): 350-363. [31] GUO L D, ZHANG J Z, GUEGUEN C. Speciation and fluxes of nutrients (N, P, Si) from the upper Yukon River [J]. Global Biogeochemical Cycles, 2004, 18(1): 1-12. [32] LIU Z, YAO Z, HUANG H, et al. Land use and climate changes and their impacts on runoff in the yarlung zangbo river basin, china [J]. Land Degradation & Development, 2014, 25(3): 203-215. [33] YU P S, WANG Y C, CHUNCHAO K, et al. Effects of land-use change on runoff response in the ungauged Ta-Chou basin, Taiwan [C]//Erosion Prediction in Ungauged Basins: Integrating Methods and Techniques An international Symposium. The Proceedings of symposium HS01 held during the IUGG2003. Sapporo, 2003: 162-170. [34] DAI S B, YANG S L, LI M. The sharp decrease in suspended sediment supply from China's rivers to the sea: anthropogenic and natural causes [J]. International Association of Scientific Hydrology Bulletin, 2009, 54(1): 135-146. DOI: 10.1623/hysj.54.1.135. [35] MILLIMAN J D, FARNSWORTH K L. River Discharge to the Coastal Ocean: A Global Synthesis [M]. Cambs: Cambridge University Press, 2011. [36] SYVITSKI J P M, VOROSMARTY C J, KETTNER A J. Impact of humans on the flux of terrestrial sediment to the global coastal ocean [J]. Science, 2005, 308(5720): 376-380. DOI: 10.1126/science.1109454. [37] LIU F, YANG Q S, CHEN S L, et al. Temporal and spatial variability of sediment flux into the sea from the three largest rivers in China [J]. Journal of Asian Earth Sciences, 2014, 87(12): 102-115. [38] WANG S, FU B J, PIAO S L, et al. Reduced sediment transport in the Yellow River due to anthropogenic changes [J]. Nature Geoscience, 2015, 9(1): 38-41. [39] 秦甲, 丁永建, 叶柏生, 等. 中国西北山地景观要素对河川径流的影响作用分析 [J]. 冰川冻土, 2011, 33(2): 397-404. [40] 潘大庆. 第三届世界水论坛国家报告——印度 [J]. 小水电, 2004(2): 8-17. DOI: 10.3969/j.issn.1007-7642.2004.02.003. [41] GUPTA A. Large Rivers: Geomorphology and Management [M]. New Jersey: John Wiley & Sons, Ltd, 2008. [42] LU X X, SIEW R Y. Water discharge and sediment flux changes over the past decades in the Lower Mekong River: Possible impacts of the Chinese dams [J]. Hydrology & Earth System Sciences, 2006, 10(2): 181-195. -

 点击查看大图
计量
- 文章访问数: 244
- HTML全文浏览量: 119
- PDF下载量: 8
- 被引次数: 0