


A microclimatic impact analysis on multi-dimensional indicators of urban road fabric: Empirical research on Shanghai
-
摘要: 不同历史背景和规划理念下形成一个城市的不同道路肌理形态, 不同的道路肌理形态又影响作用于城市微气候因子而形成了独特的局地微气候. 以上海老城厢、古北社区、安亭新镇和新江湾城4个城市肌理为研究对象, 利用ENVI-met4.3模拟软件对4个区域的微气候进行模拟, 进而从中观与微观方面对比分析城市道路肌理的微气候状况. 在中观层面分析了路幅宽度、走向、间距和连通性与气候环境的关联性; 在微观尺度分析了道路的贴线率、高宽比(H/W)和天空开阔度(SVF)指标对道路的微气候因子分布特征的影响. 这一尺度的微气候特征比较分析研究对城市设计及空间形态优化方面将提供气候适应性发展的有益建议.Abstract: Different historical backgrounds and planning ideas result in different road fabrics for a city. Road fabric patterns affect urban microclimate factors and form a unique local microclimate. In this paper, we studied the road fabric of four “city” areas in Shanghai (i.e., the old downtown area, Gubei international community, Anting new town, and new Jiangwan town) by simulating the microclimate of the four research areas using ENVI-met4.3 software; we then used the data to compare the microclimate status of urban fabric at the medium and micro levels. At the medium level, the relationship between width, orientation, spacing, connectivity, and the climate environment was analyzed. At the micro level, the effects of Near-line Rate, Height to Wide ratio (H/W) and Sky View Factor (SVF) on the distribution characteristics of microclimate factors in roads were analyzed. The comparative analysis of microclimate characteristics at the “city” scale provides useful insights for urban climate adaptability in urban design projects and spatial morphology optimization in future urbanization development.
-
Key words:
- urban road fabric /
- microclimate /
- road morphological index /
- ENVI-met
-

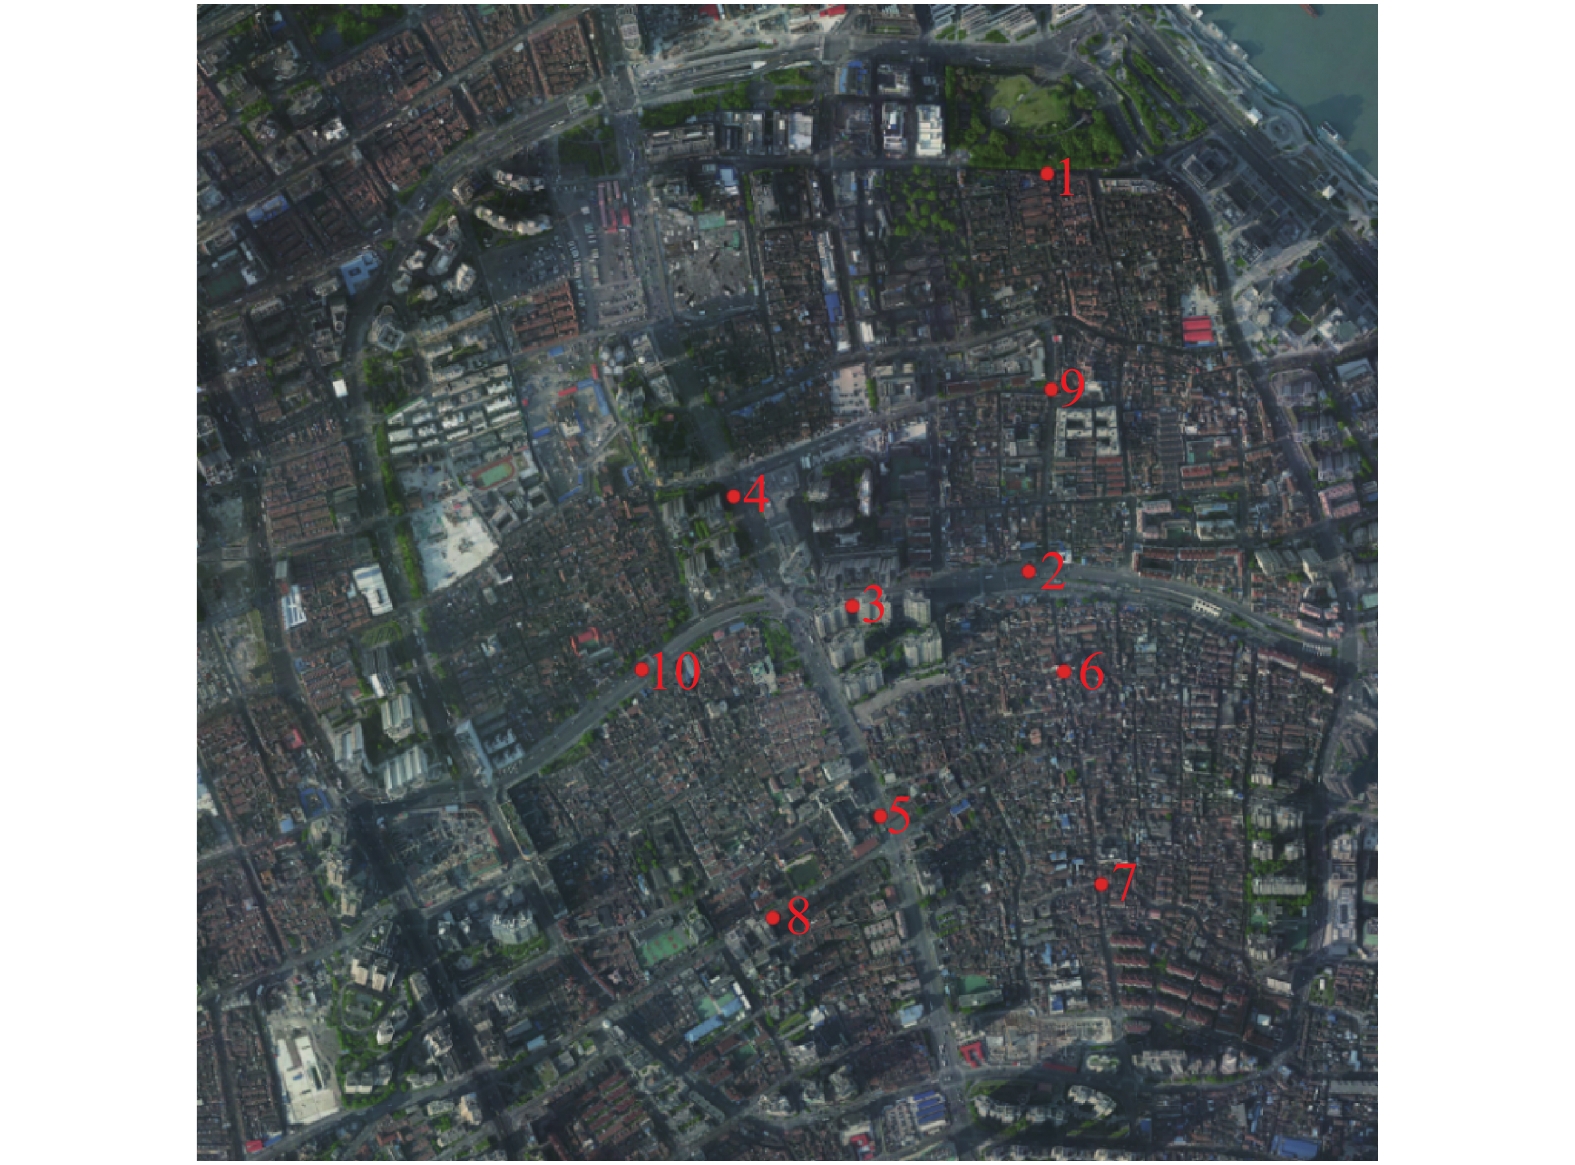
图 1 4个选择区域卫星影像图与路网图
注: (a)为老城厢, (b)为古北社区, (c)为安亭新镇, (d)为新江湾城; 红色字体路名为城市干道
Fig. 1 Satellite image and street network of the four areas studied
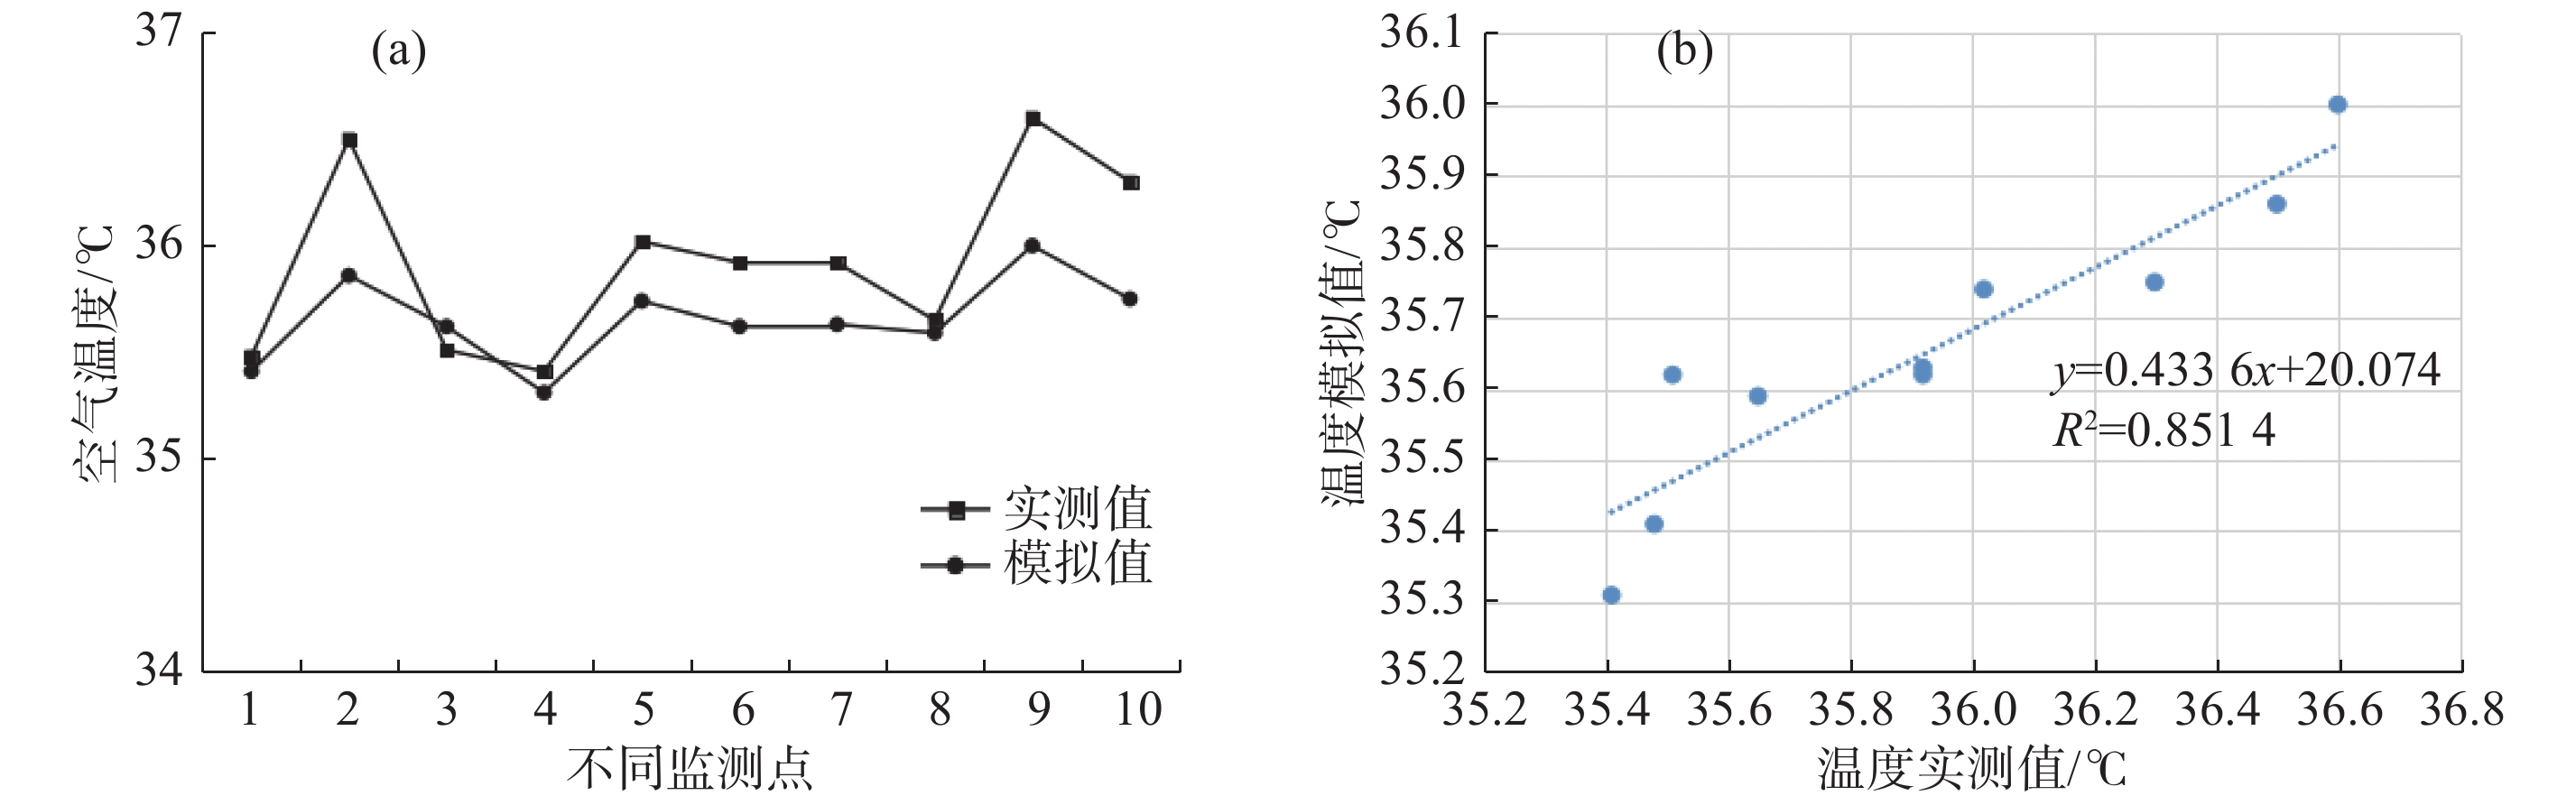
图 3 测点值与模拟值的温度差异值图和线性拟合图(地面1.5 m处)
Fig. 3 Temperature differences and linear regression analysis between the measured and simulated values
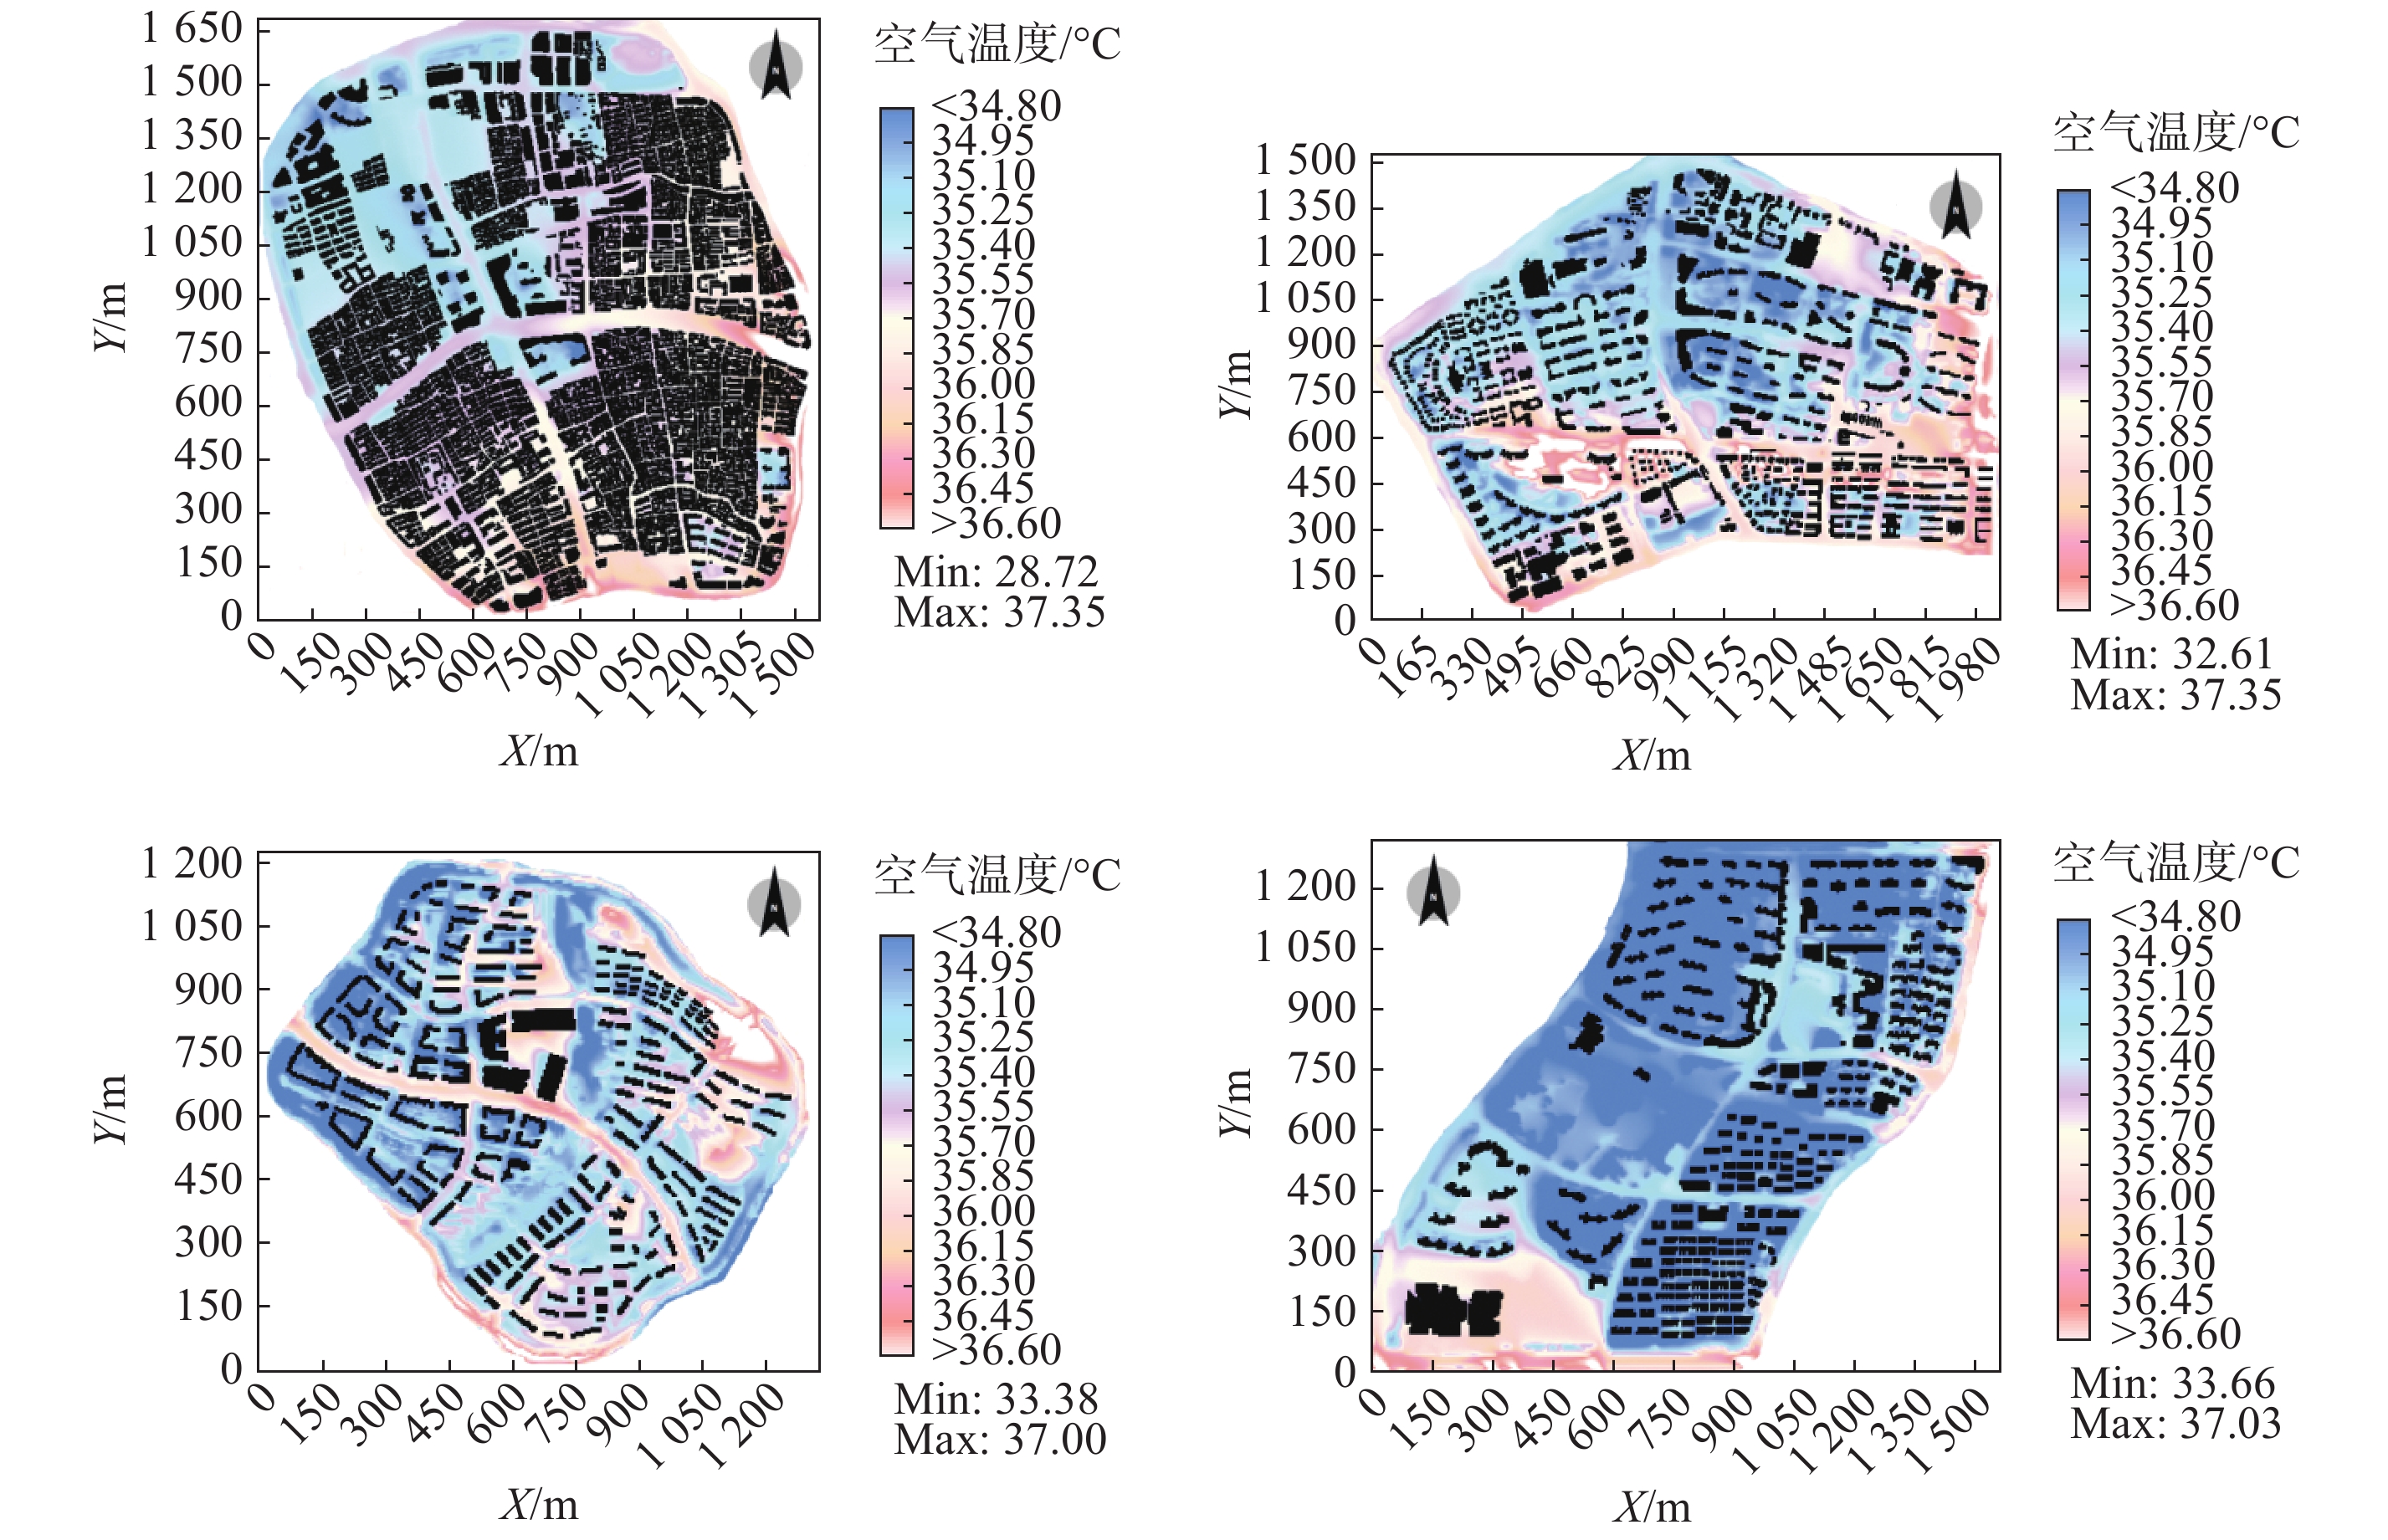
图 4 4个城市肌理9:00地面1.5 m处空气温度图
注: 左上为老城厢, 右上为古北社区, 左下为安亭新镇, 右下为新江湾城; 横坐标和纵坐标均表示距离
Fig. 4 Air temperature of the four areas studied at 9:00 am and 1.5 m

图 5 4个城市肌理9:00地面1.5 m处风速图
注: 左上为老城厢, 右上为古北社区, 左下为安亭新镇, 右下为新江湾城; 横坐标和纵坐标均表示距离
Fig. 5 Wind speed in the four areas studied at 9:00 am and 1.5 m
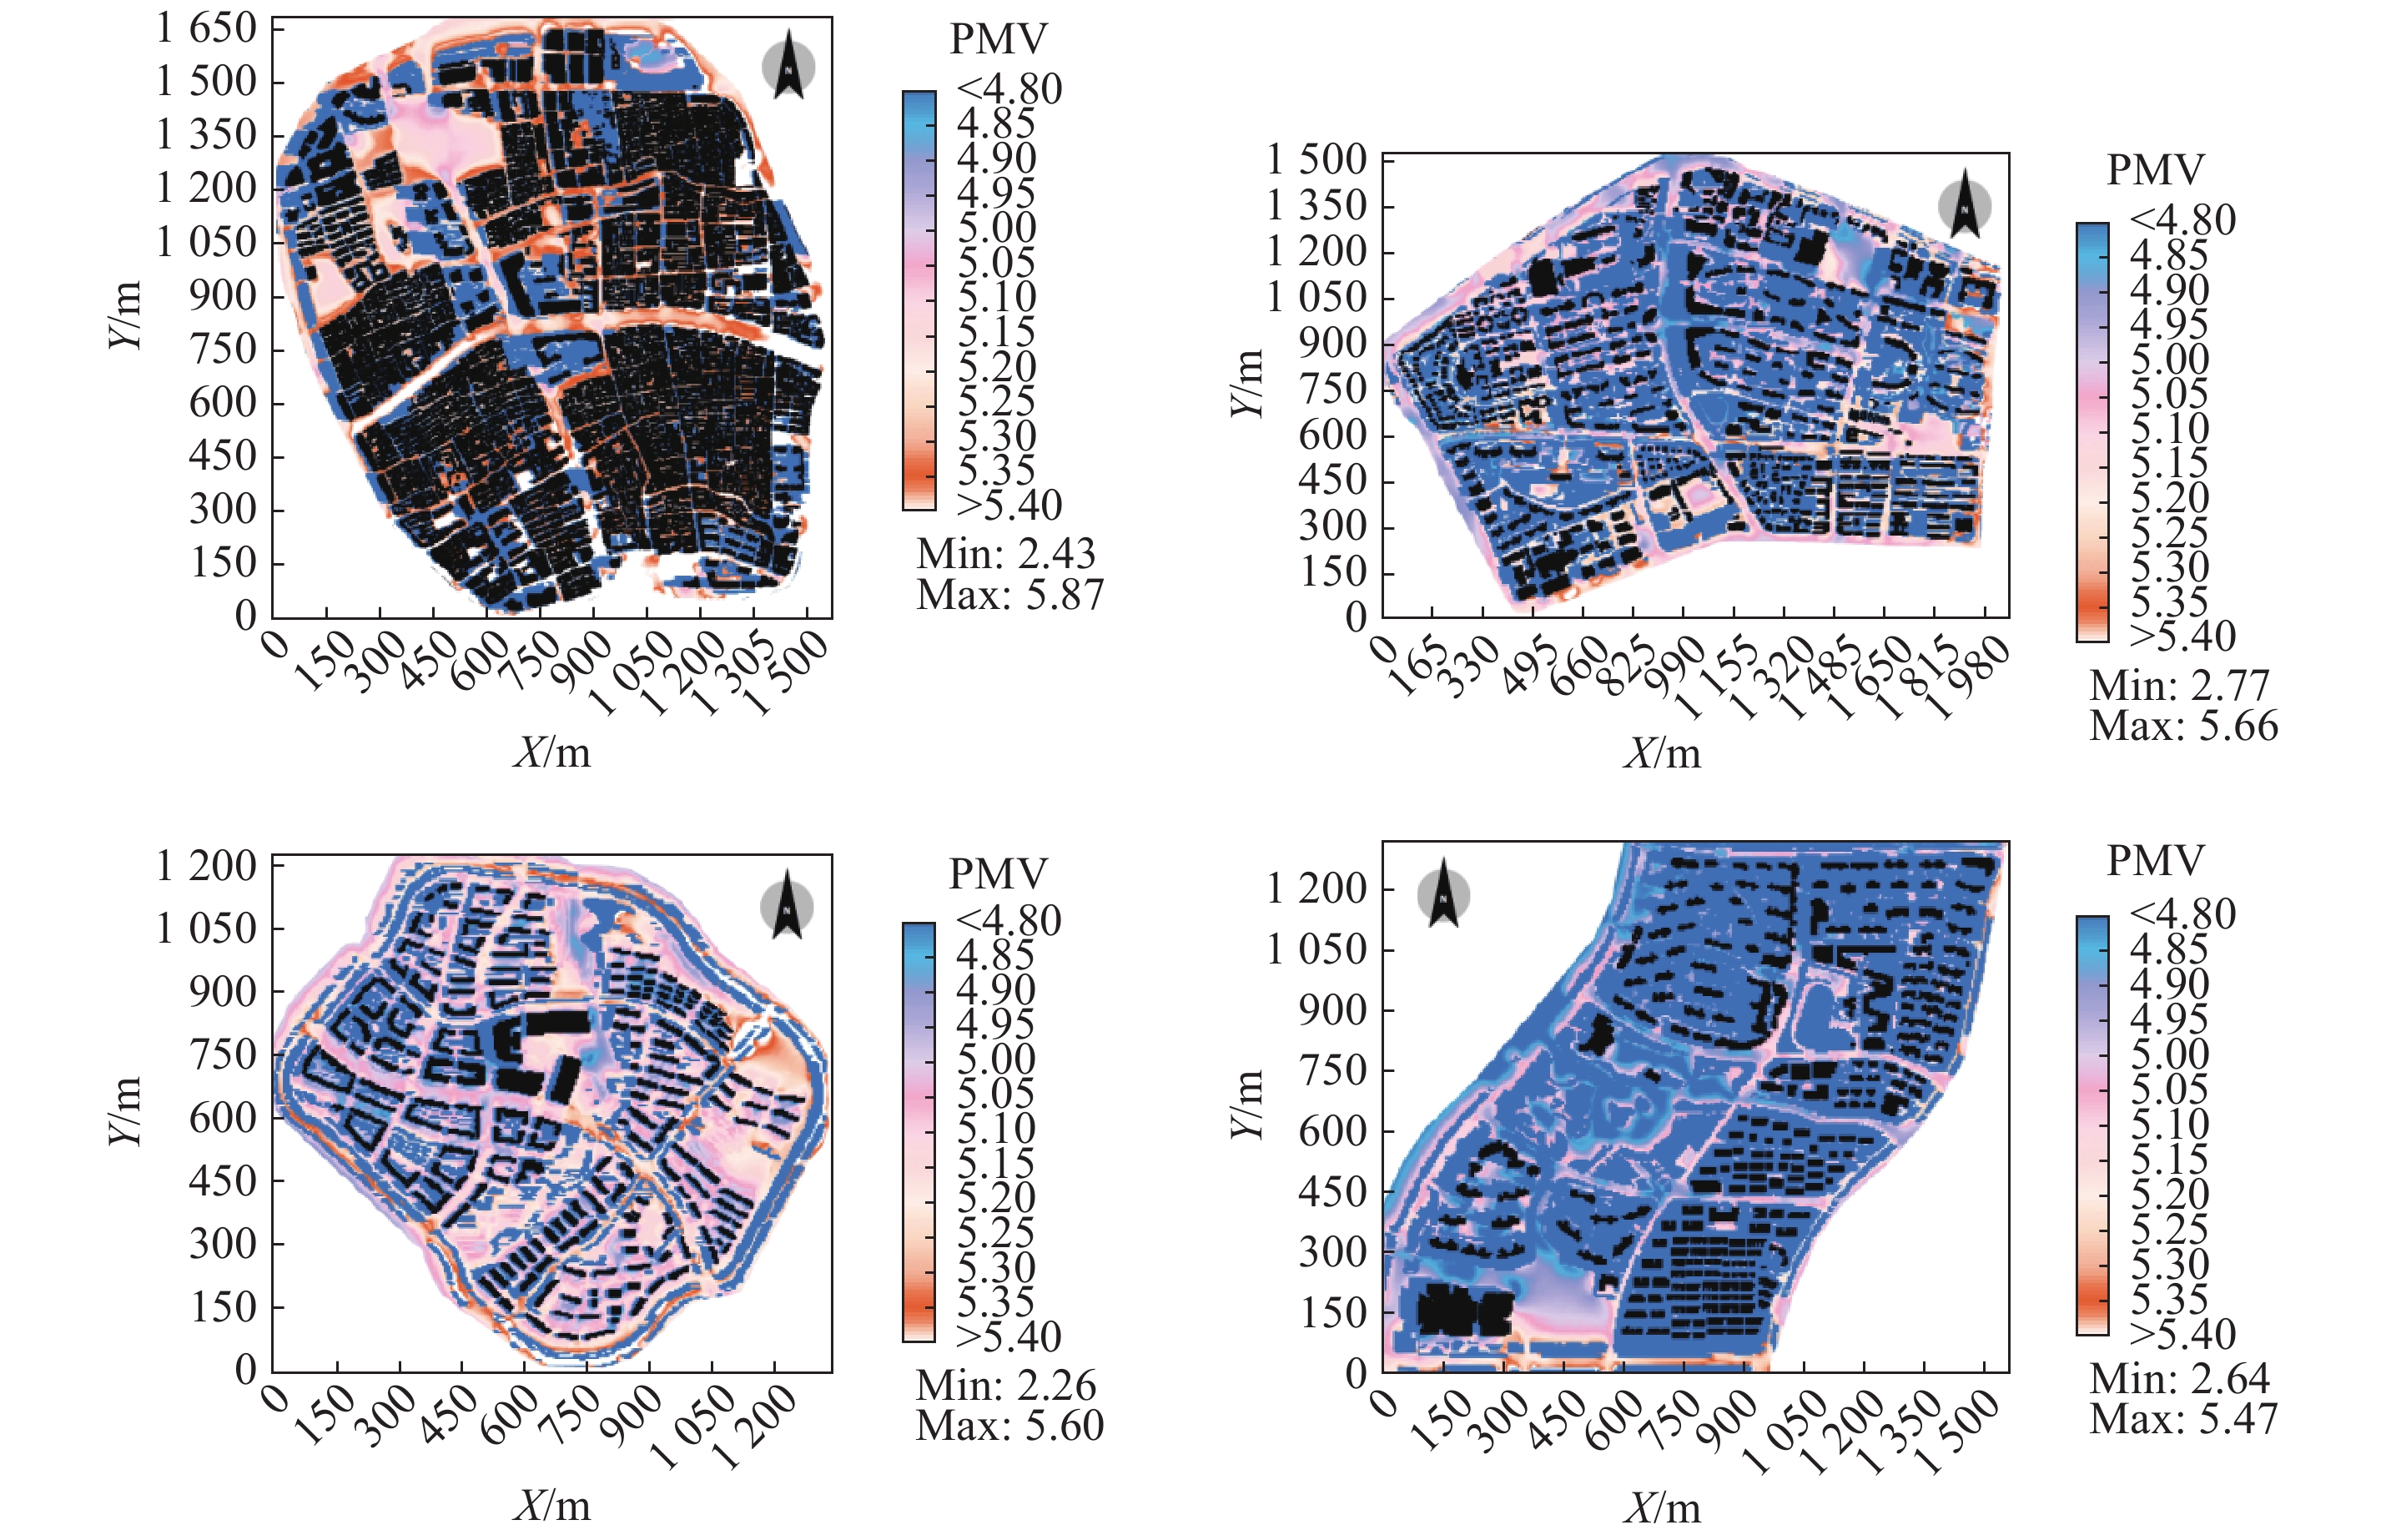
图 6 4个城市肌理9:00地面1.5 m处PMV图
注: 左上为老城厢, 右上为古北社区, 左下为安亭新镇, 右下为新江湾城; 横坐标和纵坐标均表示距离
Fig. 6 PMV of the four areas studied at 9:00 am and 1.5 m
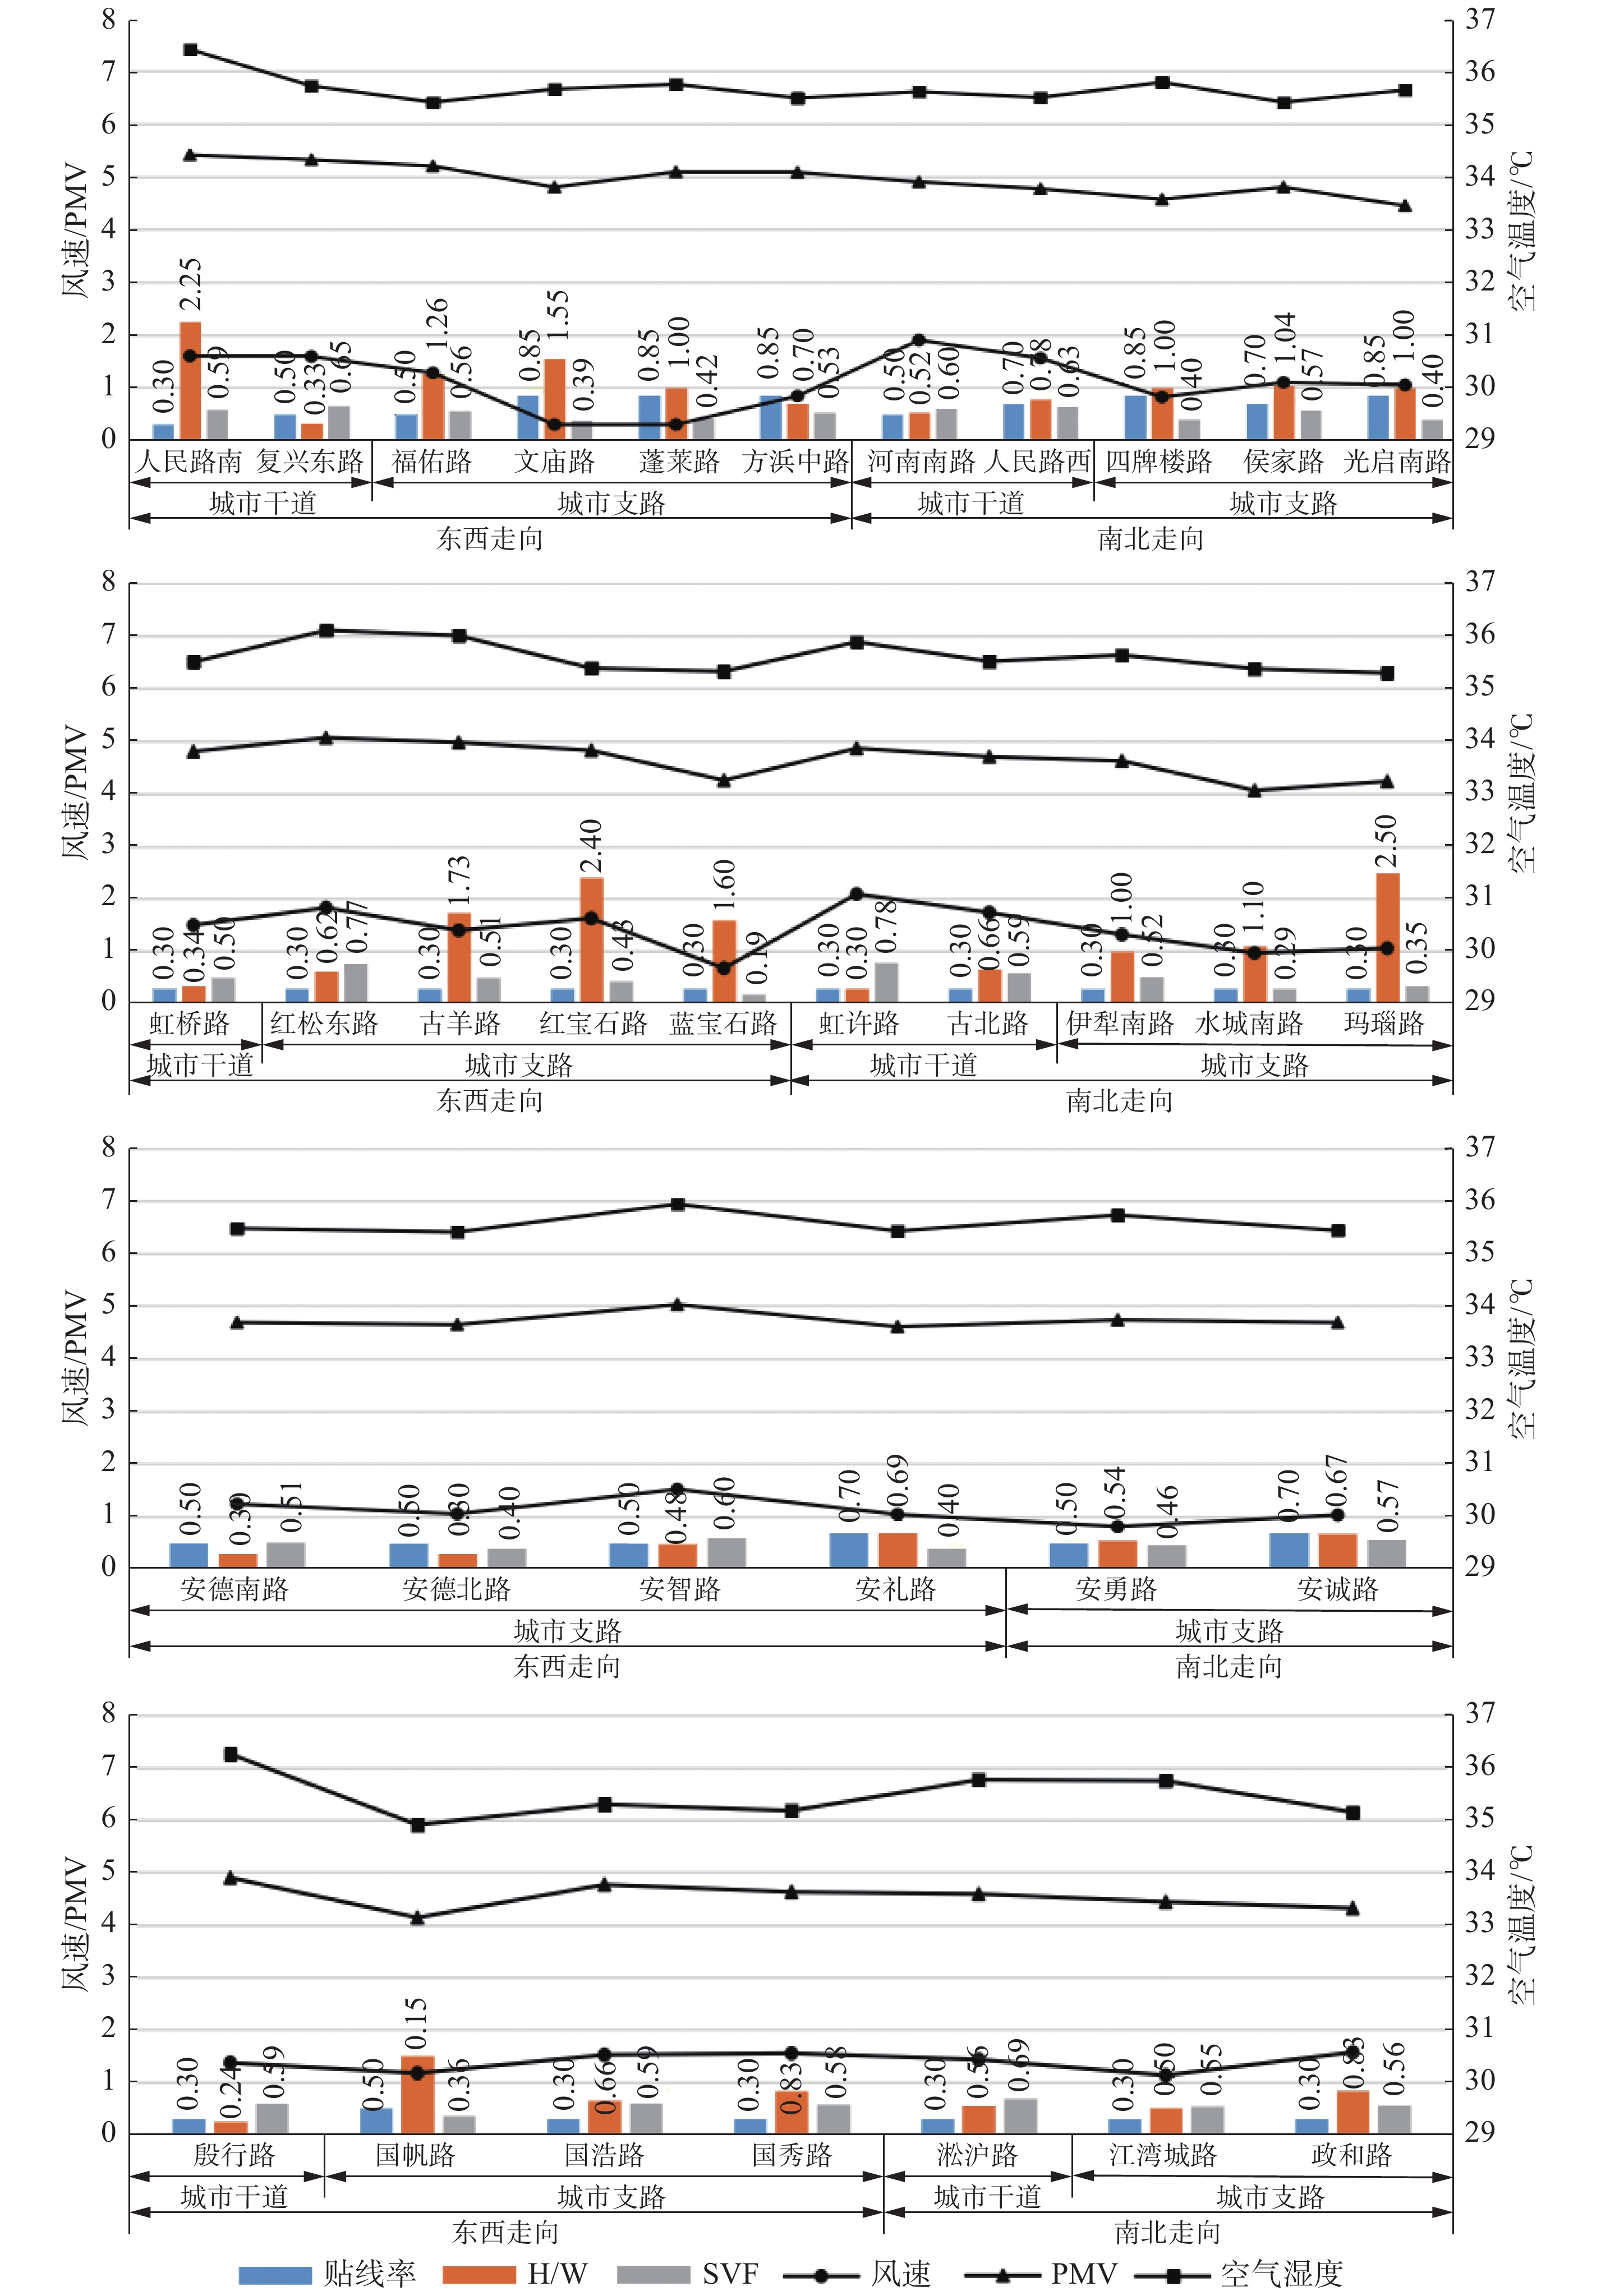
图 7 4个区域道路形态指标与道路风速、空气温度、PMV关系的对比图
注: 自上而下依次为老城厢、古北社区、安亭新镇、新江湾城; 图中风速单位为m·s-1
Fig. 7 Spatial correlation comparison diagram between the morphological indexes and microclimate factors at the street-site level of the four zones studied
表 1 4个研究区域面积、道路网指标、绿地率等基本情况表
Tab. 1 The road network, floor space, and green coverage of the four areas studied
形成时期 面积/km2 道路密度/(km·km–2) 连接度 绿地率/% 老城厢 17世纪 2.00 18.17 4.70 6.5 古北社区 20世纪90年代 1.34 8.69 3.23 31 安亭新镇 21世纪00年代 1.05 7.80 3.09 20 新江湾城 21世纪10年代 1.31 6.42 2.83 33 注: 4个研究区域的面积、道路密度、连接度和绿地率等数据是通过卫星影像地图, 结合现场勘测数据和收集到的网络数据, 经过地图校正获取  下载: 导出CSV
表 2 初始输入的气象参数值
Tab. 2 Initial input values for weather parameters in the simulation model
温度 风向 风速 湿度 粗糙度 初始值 34.79 ℃ 135° (东南方向) 3 m/s 75% 0.01
下载: 导出CSV
表 3 参数设置
Tab. 3 Parameter settings for the spatial models in the four zones studied
区域 网格数量(x,y,z) 网格大小(dx,dy,dz) 嵌套网格数量 嵌套网格属性 默认墙面属性 默认屋顶属性 老城厢 525,563,16 3,3,渐变的高度 3 Soil A: 沥青 Soil B: 水泥 混凝土 瓦片 古北社区 375,306,15 5.5,5,渐变的高度 3 Soil A: 沥青 Soil B: 水泥 混凝土 混凝土 安亭新镇 267,246,35 5,5,3 3 Soil A: 沥青 Soil B: 水泥 混凝土 混凝土 新江湾城 313,265,13 5,5,渐变的高度 3 Soil A: 沥青 Soil B: 水泥 混凝土 混凝土
下载: 导出CSV
表 4 4个区域不同道路等级和走向的空气温度
Tab. 4 Temperature of different road grades and orientation for the four areas studied
区域 走向 道路等级 空气温度/℃ 老城厢 东西走向 干道 35.60 支路 35.59 南北走向 干道 35.56 支路 35.56 古北社区 东西走向 干道 35.61 支路 35.45 南北走向 干道 35.51 支路 35.43 安亭新镇 东西走向 支路 35.47 南北走向 支路 35.58 新江湾城 东西走向 干道 35.85 支路 35.23 南北走向 干道 35.76 支路 35.15
下载: 导出CSV
表 5 4个区域不同间距的道路温度与区域温度差值
Tab. 5 Difference between road temperature values and zone temperature values at different distances in the four areas studied
区域 间距/m 温度差值Δt/℃ 老城厢 100以下 0.06 100~200 0.09 古北社区 100~200 0.05 200~300 0.18 安亭新镇 300~400 0.14 400~500 0.24 新江湾城 400~450 0.09 450~500 0.78
下载: 导出CSV
表 6 4个区域不同连接度的温度变异系数
Tab. 6 Temperature coefficient of variation in different connectivity of the four areas studied
老城厢 古北社区 安亭新镇 新江湾城 连接度 4.70 3.23 3.09 2.83 温度变异系数 0.010 0.012 0.014 0.037
下载: 导出CSV
表 7 4个区域不同道路等级和走向的风速
Tab. 7 Wind speed values of different road grades and orientation for the four areas studied
区域 走向 道路等级 风速/(m·s–1) 老城厢 东西走向 干道 1.64 支路 0.77 南北走向 干道 1.71 支路 1.01 古北社区 东西走向 干道 1.56 支路 1.37 南北走向 干道 1.74 支路 1.20 安亭新镇 东西走向 支路 1.16 南北走向 支路 0.97 新江湾城 东西走向 干道 1.37 支路 1.41 南北走向 干道 1.42 支路 1.14
下载: 导出CSV
表 8 4个区域不同间距的道路风速与区域风速差值
Tab. 8 Difference between the road wind speed and zone wind speed at different distances for the four areas studied
区域 间距/m 风速变化ΔW/(m·s–1) 老城厢 100以下 0.07 100~200 0.74 古北社区 100~200 0.54 200~300 0.58 安亭新镇 300~400 0.07 400~500 0.13 新江湾城 400~450 0.34 450~500 0.42
下载: 导出CSV
表 9 4个区域连接度的风速变异系数
Tab. 9 Wind coefficient of variation in different connectivity of the four areas studied
老城厢 古北社区 安亭新镇 新江湾城 连接度 4.70 3.23 3.09 2.83 风速变异系数 0.47 0.40 0.38 0.37
下载: 导出CSV
表 10 4个区域不同道路等级和走向的PMV值
Tab. 10 PMV values of different road grades and orientation for the four areas studied
区域 走向 道路等级 PMV 老城镇 东西走向 干道 5.28 支路 5.09 南北走向 干道 4.94 支路 4.65 古北社区 东西走向 干道 4.94 支路 4.88 南北走向 干道 4.69 支路 4.40 安亭新镇 东西走向 支路 4.70 南北走向 支路 4.70 新江湾城 东西走向 干道 4.89 支路 4.59 南北走向 干道 4.53 支路 4.39
下载: 导出CSV
表 11 4个区域不同间距的道路PMV值与区域PMV的差值
Tab. 11 Difference between the road PMV values and zone PMV values at different distances for the four areas studied
区域 间距/m ΔPMV 老城厢 100以下 0.06 100~200 0.30 古北社区 100~200 0.13 200~300 0.27 安亭新镇 300~400 0.13 400~500 0.28 新江湾城 400~450 0.13 450~500 0.41
下载: 导出CSV
表 12 4个区域连接度的PMV变异系数
Tab. 12 PMV coefficient of variation in different connectivity of the four areas studied
老城厢 古北社区 安亭新镇 新江湾城 连接度 4.70 3.23 3.09 2.83 PMV变异系数 0.12 0.14 0.16 0.17
下载: 导出CSV
表 13 道路形态指标与空气温度相关性
Tab. 13 Correlation between morphological indexes and air temperature at the street-site level for the four areas studied
区域 道路指标 p值 R2 相关系数r 老城厢 贴线率 0.02** 0.570 –0.755 H/W 0.25 0.846 –0.920 SVF 0.06* 0.539 0.734 古北社区 贴线率 -- -- -- H/W 0.1* 0.630 –0.794 SVF 0.02** 0.849 0.921 安亭新镇 贴线率 0.06* 0.878 –0.937 H/W 0.008*** 0.983 –0.991 SVF 0.1* 0.807 0.898 新江湾城 贴线率 0.2 0.374 –0.612 H/W 0.03*** 0.717 –0.847 SVF 0.1* 0.510 0.714 注: ***、**和*分别表示在1%、5%和10%的水平下的显著性检验
下载: 导出CSV
表 14 道路形态指标与风速的相关性
Tab. 14 Correlation between morphological indexes and wind-speed at the street-site level for the four areas studied
区域 道路指标 p值 R2 相关系数r 老城厢 贴线率 0.002*** 0.823 –0.908 H/W 0.01*** 0.894 –0.945 SVF 0.01*** 0.694 0.833 古北社区 贴线率 -- -- -- H/W 0.15 0.549 –0.741 SVF 0.001*** 0.881 0.934 安亭新镇 贴线率 0.41 0.262 –0.512 H/W 0.13 0.511 –0.474 SVF 0.01*** 0.979 0.989 新江湾城 贴线率 0.1* 0.316 –0.562 H/W 0.006*** 0.717 0.847 SVF 0.003*** 0.772 0.879 注: ***、**和*分别表示在1%、5%和10%的水平下的显著性检验
下载: 导出CSV
表 15 道路形态指标与PMV的相关性
Tab. 15 Correlation between morphological indexes and PMV at the street-site level of the four areas studied
区域 道路指标 p值 R2 相关系数r 老城厢 贴线率 0.02** 0.840 –0.916 H/W 0.21 0.456 –0.675 SVF 0.03** 0.824 0.908 古北社区 贴线率 -- -- -- H/W 0.20 0.778 –0.882 SVF 0.005*** 0.835 0.914 安亭新镇 贴线率 0.25 0.550 –0.741 H/W 0.1* 0.788 –0.887 SVF 0.05** 0.829 0.910 新江湾城 贴线率 0.09* 0.535 –0.731 H/W 0.01*** 0.965 –0.982 SVF 0.03** 0.911 0.954 注: ***、**和*分别表示在1%、5%和10%的水平下的显著性检验
下载: 导出CSV
-
[1] OKE T R. Urban Environments [M]. [S.l.]: McGill–Queen’s University Press, 1997. [2] 周淑贞, 张超. 城市气候学导论 [M]. 上海: 华东师范大学出版社, 1985. [3] 石华. 基于深圳市道路气流特征的城市通风网络模型研究 [D]. 重庆: 重庆大学, 2012. [4] AMBROSINI D, GALLI G, MANCINI B, et al. Evaluating mitigation effects of urban heat islands in a historical small center with the ENVI-met ® climate model [J]. Sustainability, 2014, 6(10): 7013-7029. DOI: 10.3390/su6107013. [5] 祝善友, 高牧原, 陈亭, 等. 基于ENVI-met模式的城市近地表气温模拟与分析——以南京市部分区域为例 [J]. 气候与环境研究, 2017, 22(4): 499-507. DOI: 10.3878/j.issn.1006-9585.2017.16197. [6] 童明. 城市肌理如何激发城市活力 [J]. 城市规划学刊, 2014(3): 14. [7] 邓浩, 宋峰, 蔡海英. 城市肌理与可步行性——城市步行空间基本特征的形态学解读 [J]. 建筑学报, 2013(6): 8-13. DOI: 10.3969/j.issn.0529-1399.2013.06.002. [8] ADOLPHE L. A simplified model of urban morphology: Application to an analysis of the environmental performance of cities [J]. Environment and Planning B-planning & Design, 2001, 28(2): 183-200. [9] YOSHIDA H, OMAE M. An approach for analysis of urban morphology: Methods to derive morphological properties of city blocks by using an urban landscape model and their interpretations [J]. Computers, Environment and Urban Systems, 2005, 29(2): 223-247. DOI: 10.1016/j.compenvurbsys.2004.05.008. [10] ALAVIPANAH S, SCHREYER J, HAASE D, et al. The effect of multi-dimensional indicators on urban thermal conditions [J]. Journal of Cleaner Production, 2018, 177: 115-123. DOI: 10.1016/j.jclepro.2017.12.187. [11] CAO A, LI Q, MENG Q. Effects of orientation of urban roads on the local thermal environment in Guangzhou City [J]. Procedia Engineering, 2015, 121: 2075-2082. DOI: 10.1016/j.proeng.2015.09.209. [12] CHATZIDIMITRIOU A, AXARLI K. Street canyon geometry effects on microclimate and comfort: A case study in Thessaloniki [J]. Procedia environmental sciences, 2017, 38: 643-650. DOI: 10.1016/j.proenv.2017.03.144. [13] BAKARMAN M A, CHANG J D. The influence of height/width ratio on urban heat island in hot-arid climates [J]. Procedia Engineering, 2015, 118: 101-108. DOI: 10.1016/j.proeng.2015.08.408. [14] BHASKAR D, MAHUA M. Optimisation of canyon orientation and aspect ratio in warm-humid climate: Case of Rajarhat Newtown, India [J]. Urban Climate, 2018, 24: 999-1014. [15] SONG G S, JEONG M A. Morphology of pedestrian roads and thermal responses during summer, in the urban area of Bucheon city, Korea [J]. International Journal of Biometeorology, 2016, 60(7): 999-1014. DOI: 10.1007/s00484-015-1092-9. [16] 李京津, 王建国. 南京步行街空间形式与微气候关联性模拟分析技术 [J]. 东南大学学报(自然科学版), 2016, 46(5): 1103-1109. DOI: 10.3969/j.issn.1001-0505.2016.05.035. [17] 萨林加罗斯. 城市结构原理 [M]. 阳建强, 译. 北京: 中国建筑工业出版社, 2011. [18] 熊鹏, 宋小冬. 道路网络密度与公交线网的关系分析——以上海9个典型地区为例 [J]. 上海城市规划, 2016(5): 101-108. [19] 陈治军. 城市大型社区的混合功能及规模研究——以上海几个社区为例 [D]. 上海: 同济大学, 2007. [20] 薄宏涛. 欧洲传统城市空间在中国的复合移植 [J]. 建筑学报, 2005(6): 76-78. DOI: 10.3969/j.issn.0529-1399.2005.06.023. [21] 王志军. 上海“一城九镇”空间结构及形态类型研究 [D]. 上海: 同济大学, 2007. [22] 徐毅松, 王颖禾, 范宇. 城市再生视野下的规划实践与思考—以新江湾城规划为例 [J]. 城市规划学刊, 2005(4): 93-98. DOI: 10.3969/j.issn.1000-3363.2005.04.018. [23] 郭琳琳, 李保峰, 陈宏. 我国在街区尺度的城市微气候研究进展 [J]. 城市发展研究, 2017, 24(1): 75-81. DOI: 10.3969/j.issn.1006-3862.2017.01.010. [24] BRUSE M, FLEER H. Simulating surface–plant–air interactions inside urban environments with a three dimensional numerical model [J]. Environmental Modelling & Software, 1998, 13(3/4): 373-384. [25] GUSSON C S, DUARTE D H S. Effects of built density and urban morphology on urban microclimate: Calibration of the model ENVI-met V4 for the Subtropical Sao Paulo, Brazil [J]. Procedia Engineering, 2016, 169: 2-10. DOI: 10.1016/j.proeng.2016.10.001. [26] 胡程, 邹志云, 梅亚南, 等. 城市道路网规划评价指标体系研究 [J]. 土木工程与管理学报, 2006, 23(s2): 98-101. [27] ZHANG J, HENG C K, LAI M L, et al. Evaluating environmental implications of density: A comparative case study on the relationship between density, urban block typology and sky exposure [J]. Automation in Construction, 2012, 22(4): 90-101. [28] WILLMOTT C J. Some comments on the evaluation of model performance [J]. Bulletin of the American Meteorological Society, 1982, 63(11): 1309-1369. DOI: 10.1175/1520-0477(1982)063<1309:SCOTEO>2.0.CO;2. [29] MIDDEL A, HÄB K, BRAZEL A J, et al. Impact of urban form and design on mid-afternoon microclimate in Phoenix Local Climate Zones [J]. Landscape & Urban Planning, 2014, 122(2): 16-28. -

 点击查看大图
计量
- 文章访问数: 143
- HTML全文浏览量: 147
- PDF下载量: 8
- 被引次数: 0