


Application of a surface and river network coupled model on waterlogging distribution analysis and risk assessment for a region suffering from extreme storm surges
-
摘要: 在风暴潮灾害中, 台风、天文高潮位、区间暴雨和上游洪水等因子存在同时出现的可能, 对沿海地区的防汛安全形成了较为严重的威胁. 双因子、多因子影响下的复合风暴潮灾害成为沿海地区灾害风险评估的主要研究对象. 风暴潮水通过漫堤和溃口进入陆域后, 河网对潮水的调蓄和运输作用直接影响对受灾区域灾害危险性的评估结果. 本研究选取上海市金山区作为典型区域, 基于MIKE11和MIKE21模型分别建立金山区一维河网模型和二维陆面模型, 并进行耦合计算, 模拟分析在风暴潮、台风、区间暴雨和流域洪水的综合影响下, 金山区地面积水变化过程, 为区域的灾害危险性分析提供依据. 模型计算结果表明, 在考虑陆域河网调蓄作用后, 风暴潮引起的金山区地面积水大幅度减小, 区域内整体淹没分布出现一定程度的改变. 综合考虑风暴潮及区间暴雨和流域洪水与仅考虑风暴潮条件相比, 金山区中部和北部大部分区域危险性等级降低, 西北角危险性等级升高.Abstract: Extreme precipitation and floods may occur during a storm surge hazard, accompanied by typhoon conditions and high tide levels. The combination of these factors intensifies the risk of flooding in coastal regions suffering from a storm surge. Thus, multi-impact analysis should be applied to determine flood risk during a storm surge. River networks play an important role in flood processes. The storage and transportation capacity provided by rivers can directly change the distribution of a flood. In this paper, a 1-D river network model and a 2-D surface model were respectively established and coupled to simulate the flood processes during an assumed storm surge in Jinshan District, Shanghai. The cumulative influence of the concurrent storm surge, typhoon, rainfall, and upstream flooding was explored to support hazard risk analysis for Jinshan District. The coupled model’s simulation indicated a clear decrease in the number of waterlogged areas in Jinshan District after considering the river network’s storage and transportation capacity during a storm surge event. The distribution of predicted waterlogged areas also changed; according to the simulation results, the flood risk grade decreased in the central and northern Jinshan District and rose in the Northwest corner.
-
Key words:
- storm surge /
- river network /
- 1-D and 2-D coupled hydrodynamic model
-
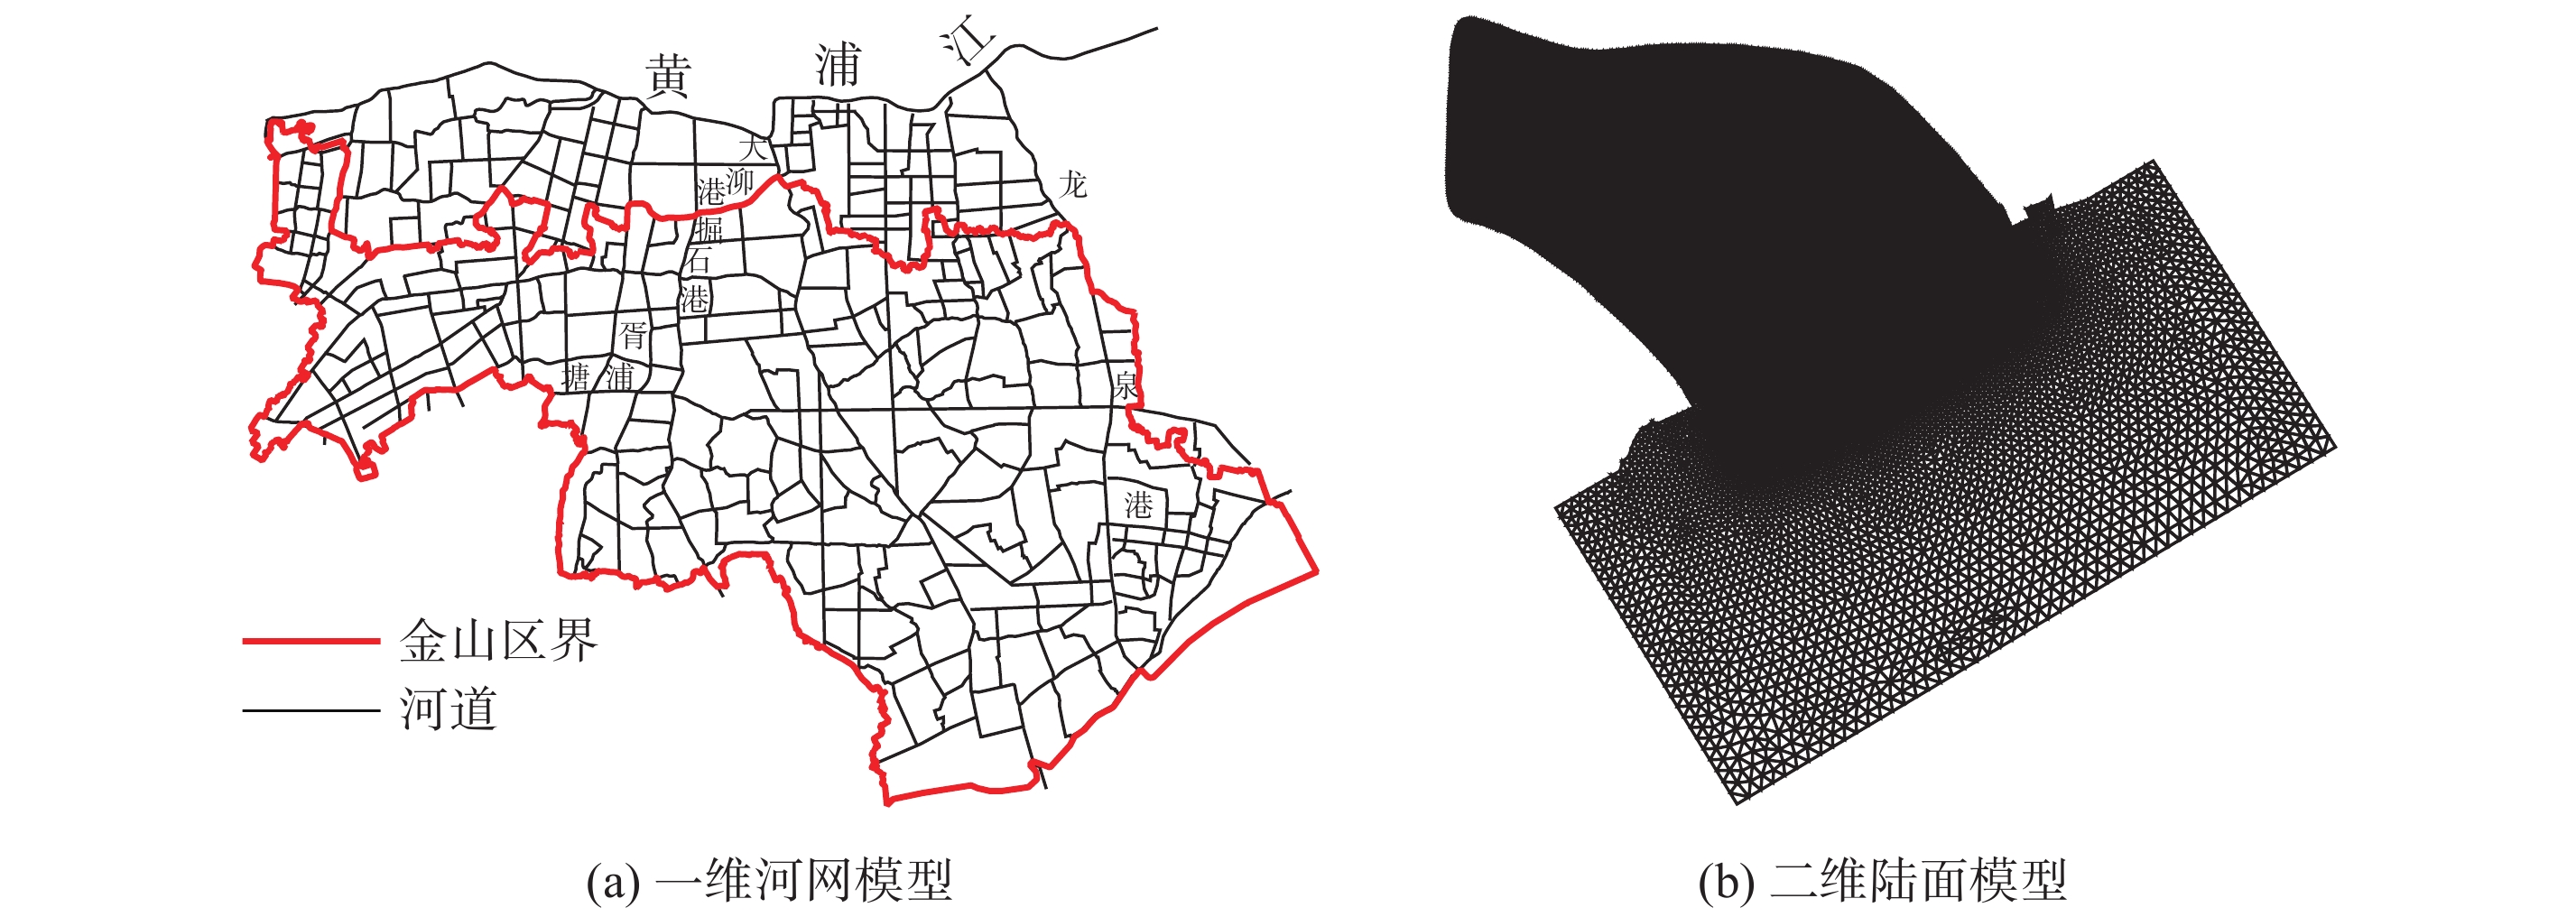
图 2 一维河网模型与二维陆面模型计算范围及河网分布
Fig. 2 Range and framework of the 1-D river network model and the 2-D surface model

图 4 “菲特”雨型20年一遇24 h降雨逐时雨量分布
Fig. 4 Hourly distribution of precipitation with “Fate” pattern and 20-year return period over 24 hours
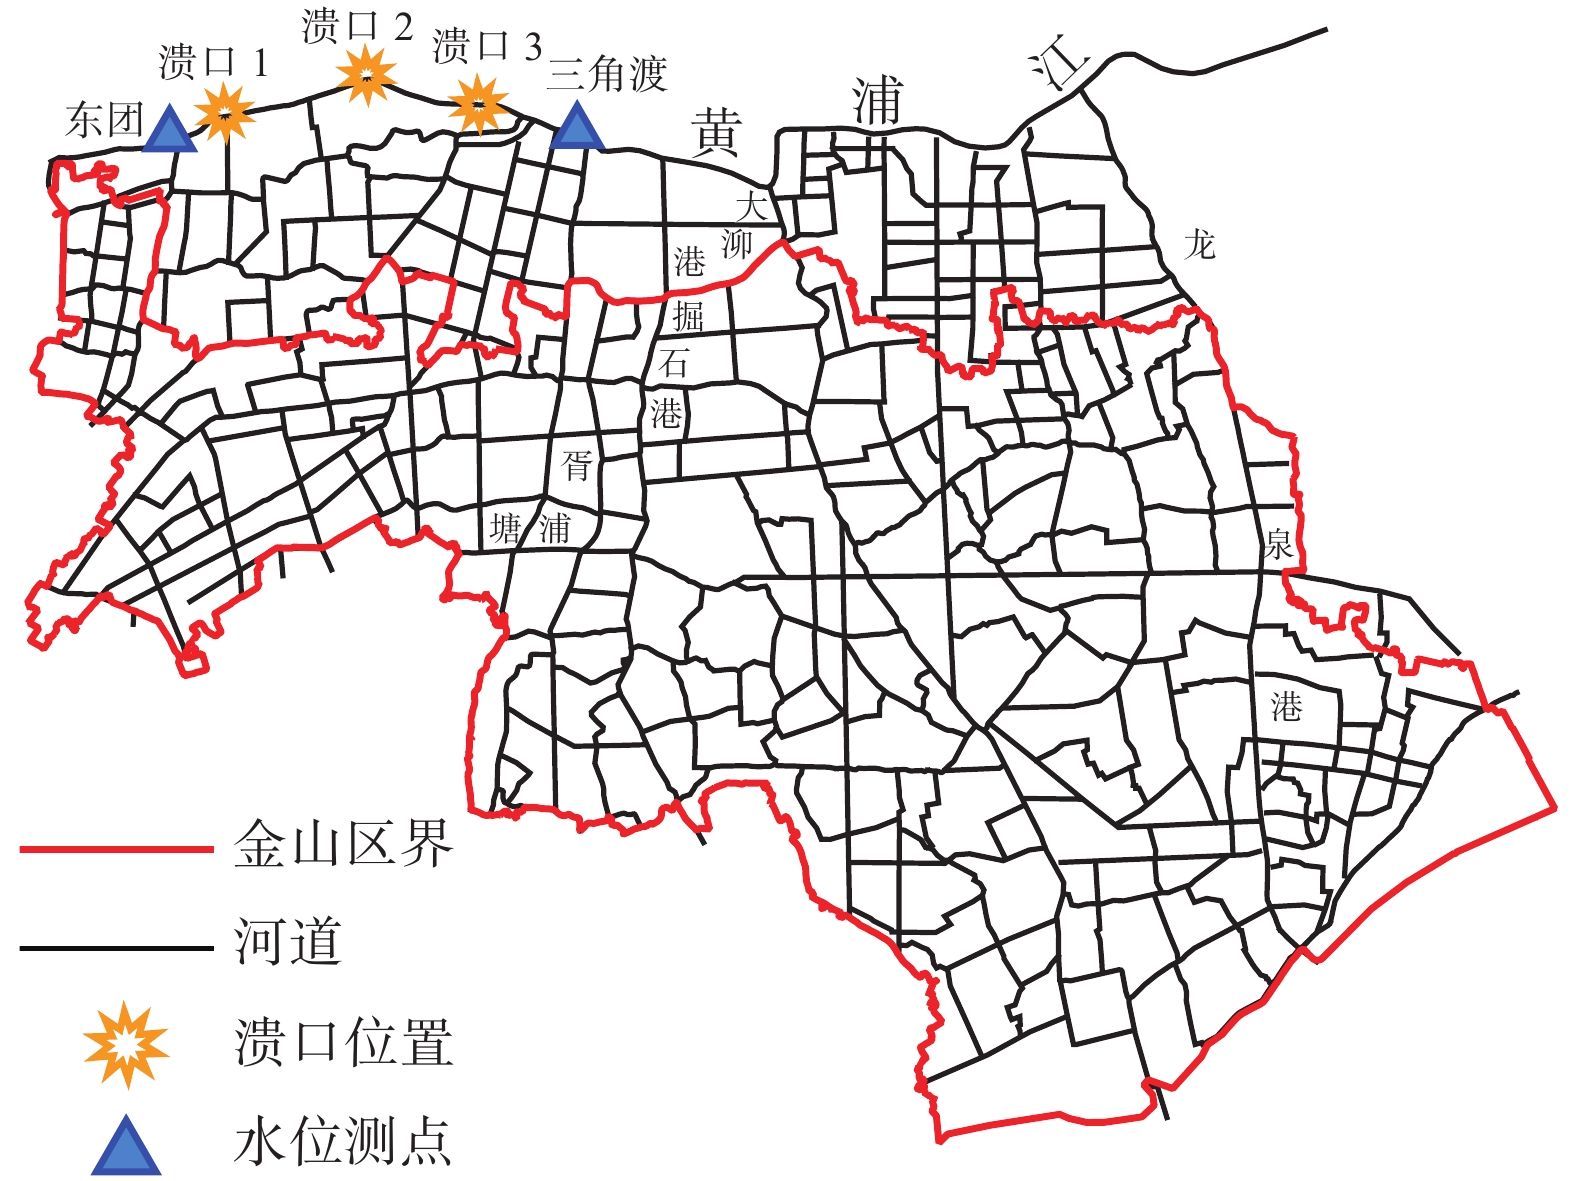
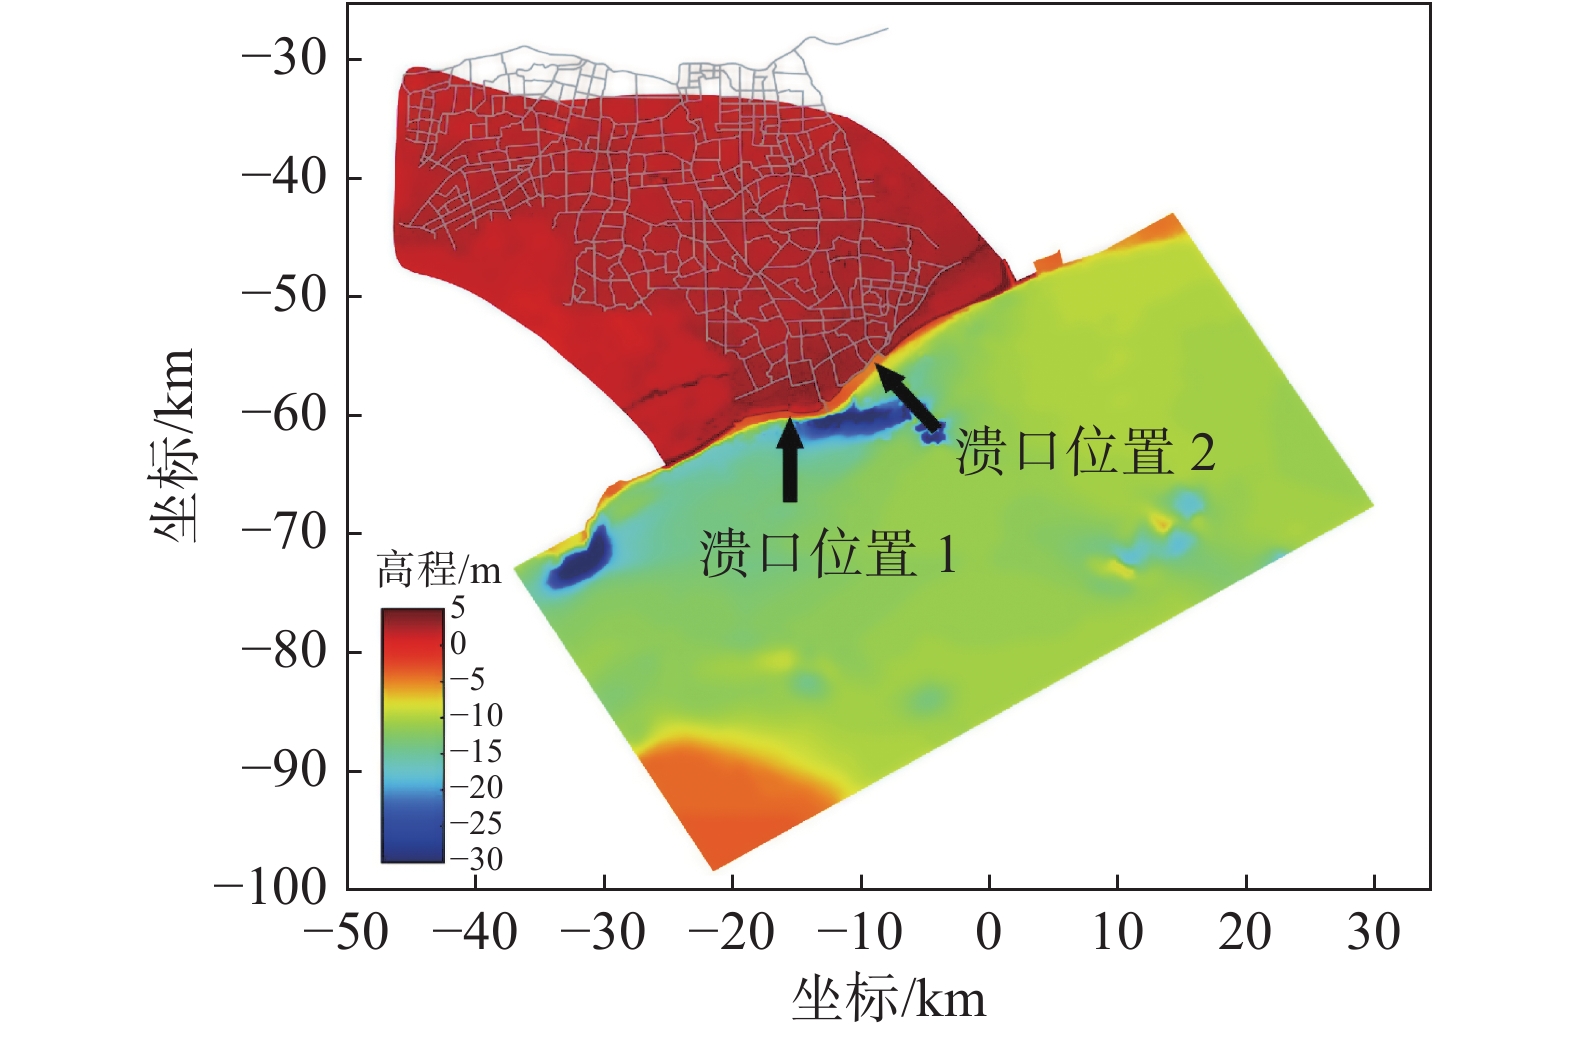
图 5 黄浦江上游红旗塘—大蒸塘—圆泄泾溃口位置分布
Fig. 5 Location of the Hongqitang to Yuanxiejing breach at the upper Huangpu River

图 6 无河网和有河网条件下金山区风暴潮进水量、地面积水量、河道调蓄量变化过程
Fig. 6 The quantity of total inflow, surface waterlogging, and stream channel storage during a storm surge event with (and without) considering the river network in Jinshan district
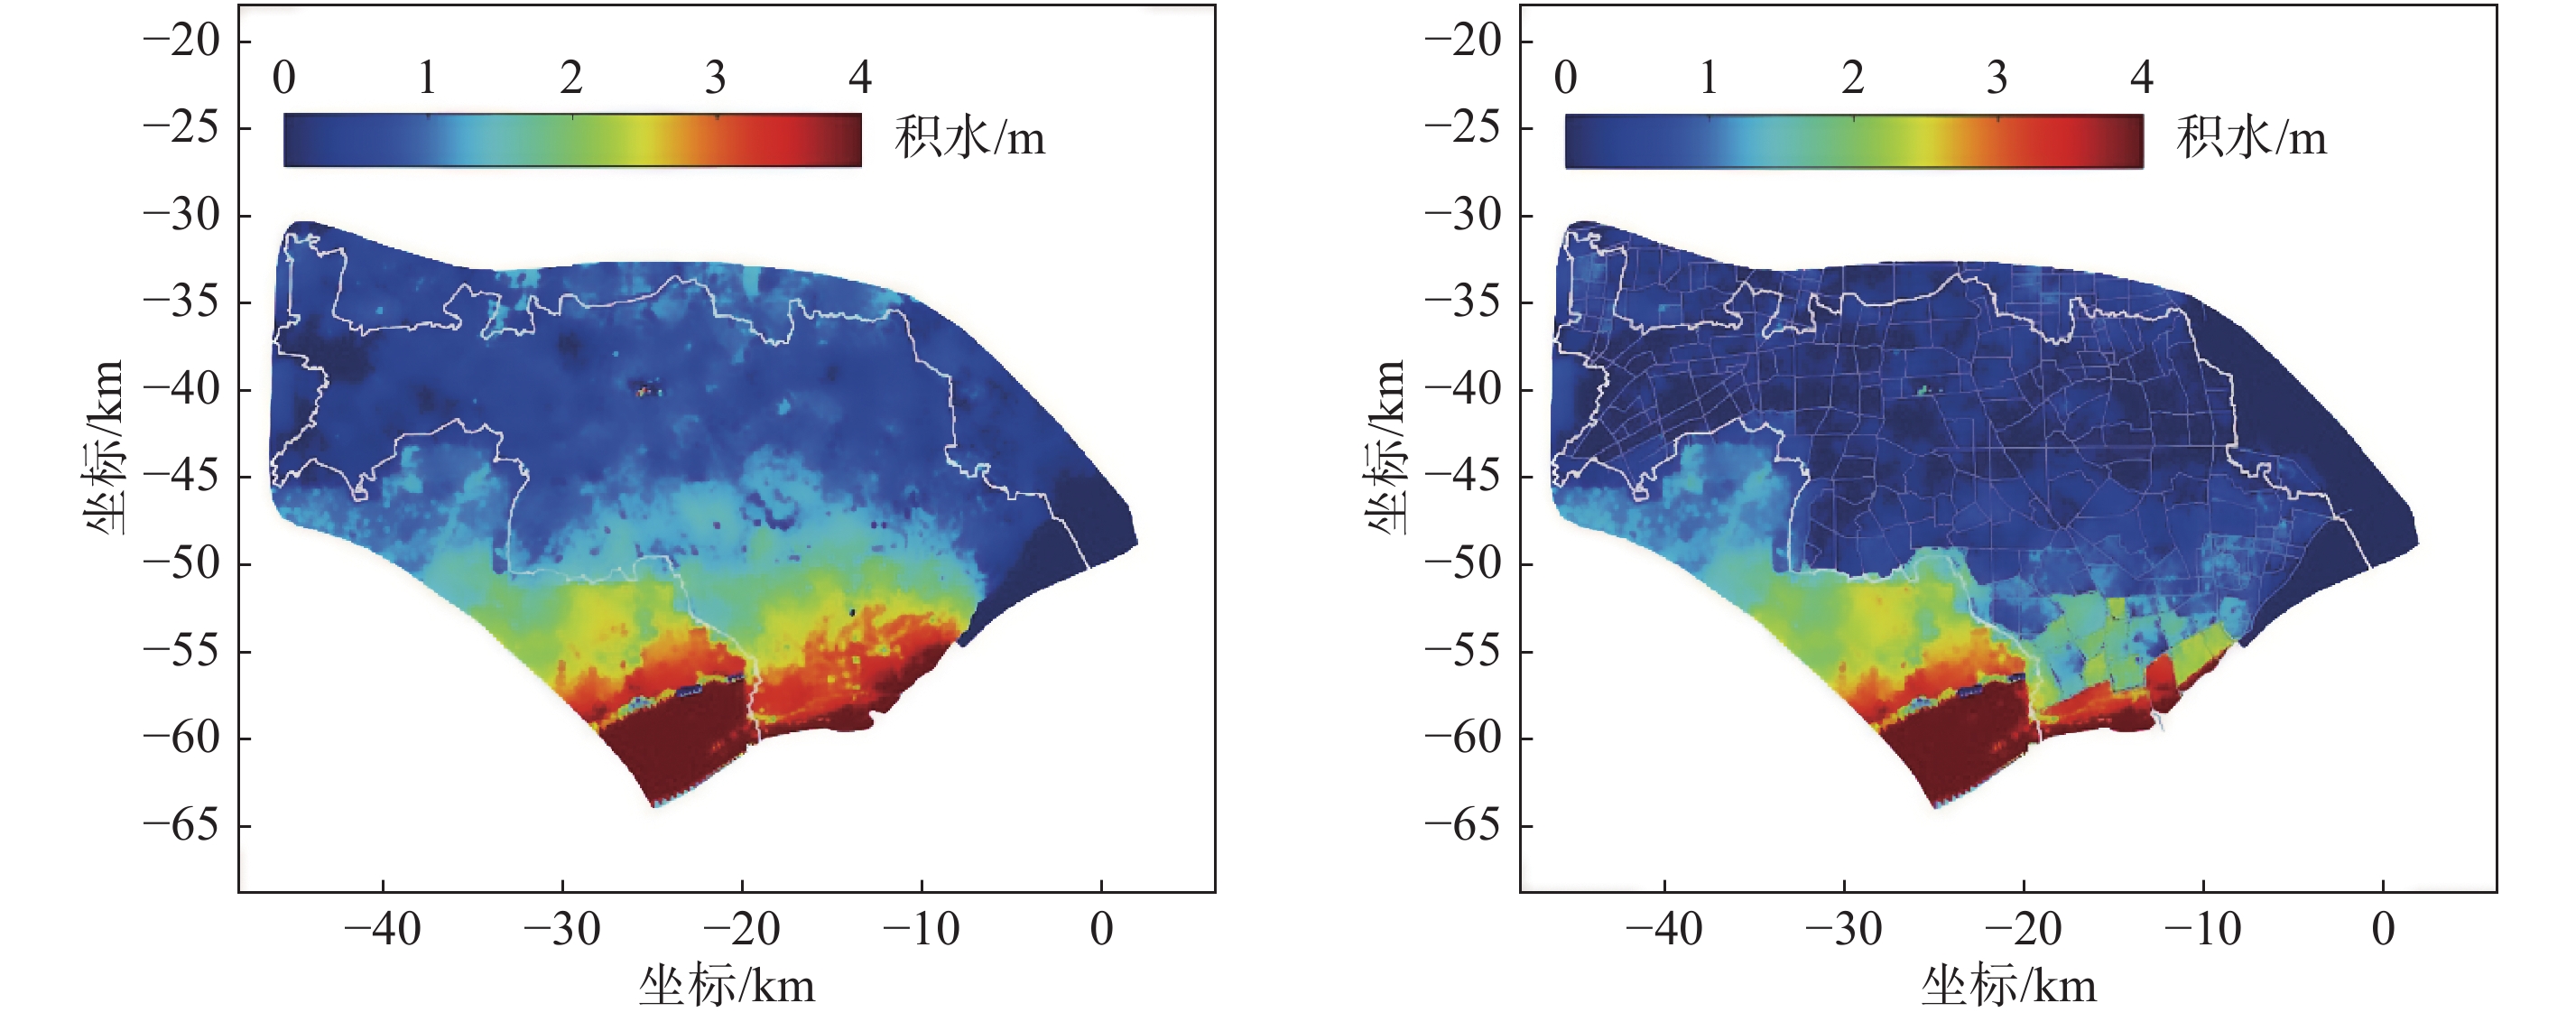
图 7 风暴潮条件下无河网(左)和有河网(右)陆域最大积水深度分布
Fig. 7 Distribution of maximum surface waterlogging during a storm surge event under calculation condition 0 (left) and calculation condition 1 (right)
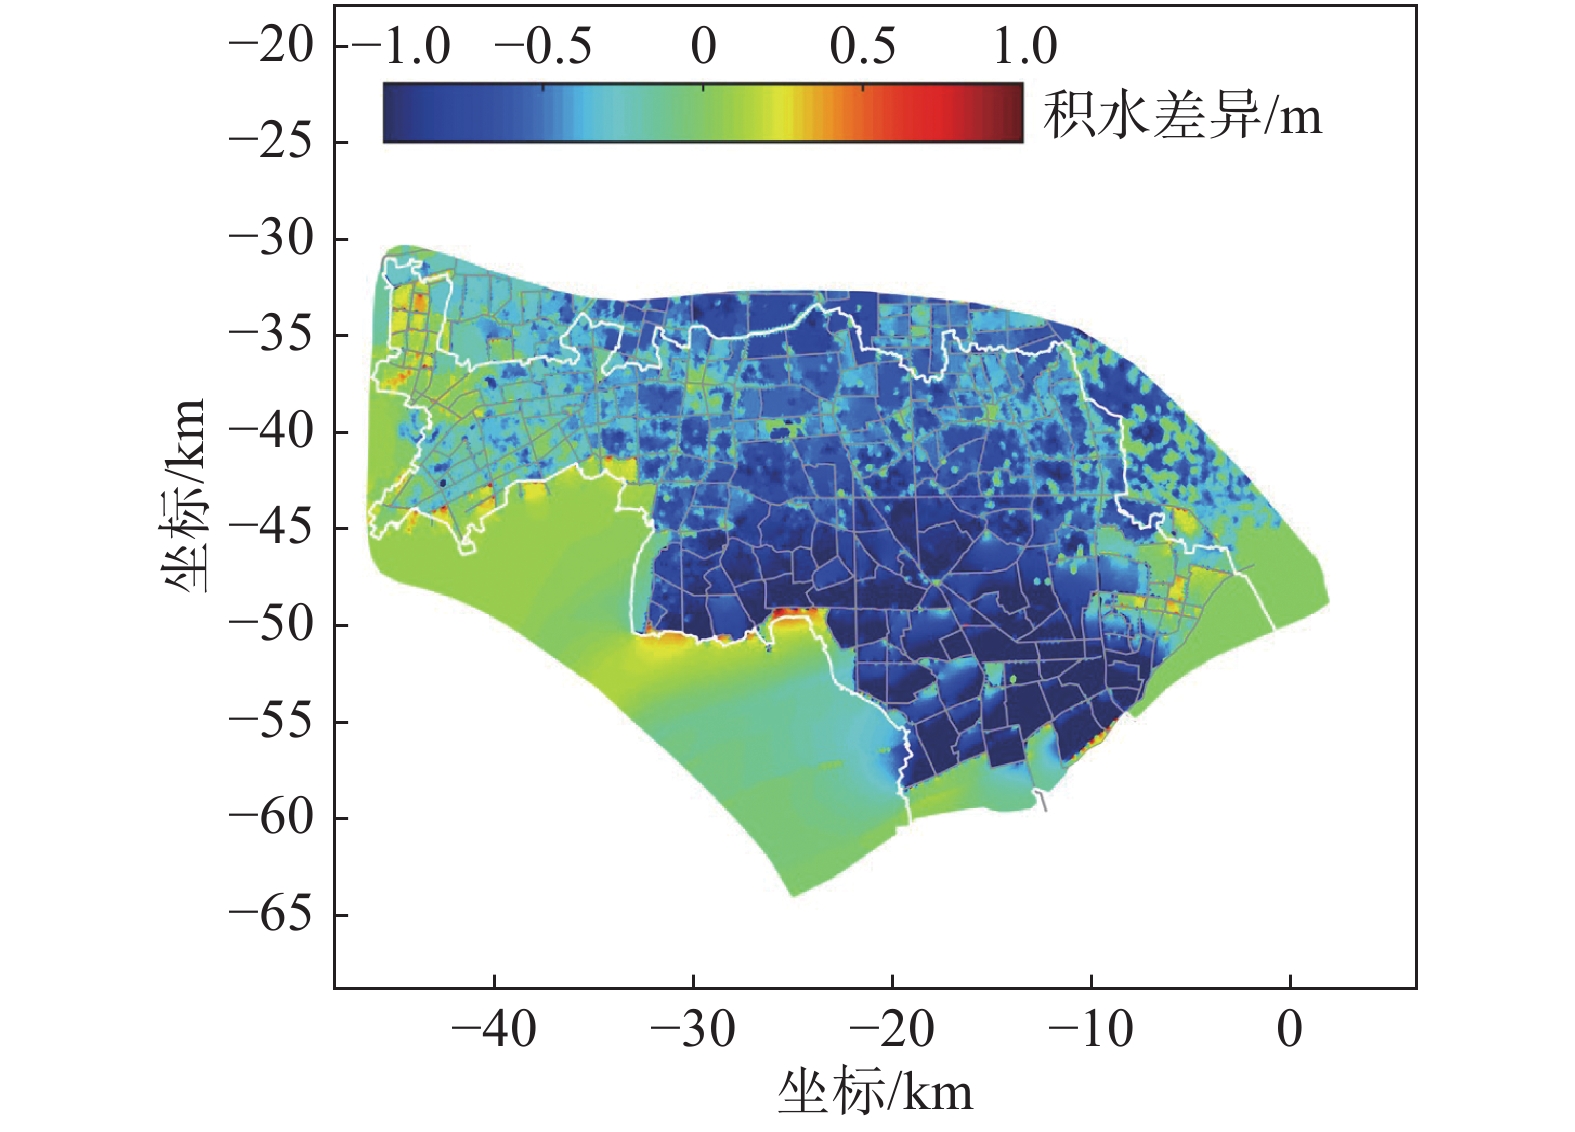
图 8 风暴潮条件下有无河网工况下陆域最大积水深度差异(有河网工况减无河网工况)
Fig. 8 Difference in maximum waterlogging depth with the river network included and excluded during a storm surge event (i.e., calculation condition 1 minus calculation condition 0)

图 9 风暴潮仅叠加降雨与同时叠加降雨和溃堤下陆域最大积水范围和最大积水深度分布比较
Fig. 9 (a) Maximum area and depth of surface waterlogging during a storm surge event with regional precipitation (calculation condition 2); (b) Maximum area and depth of surface waterlogging during a storm surge event with regional precipitation and flooding (calculation condition 3)
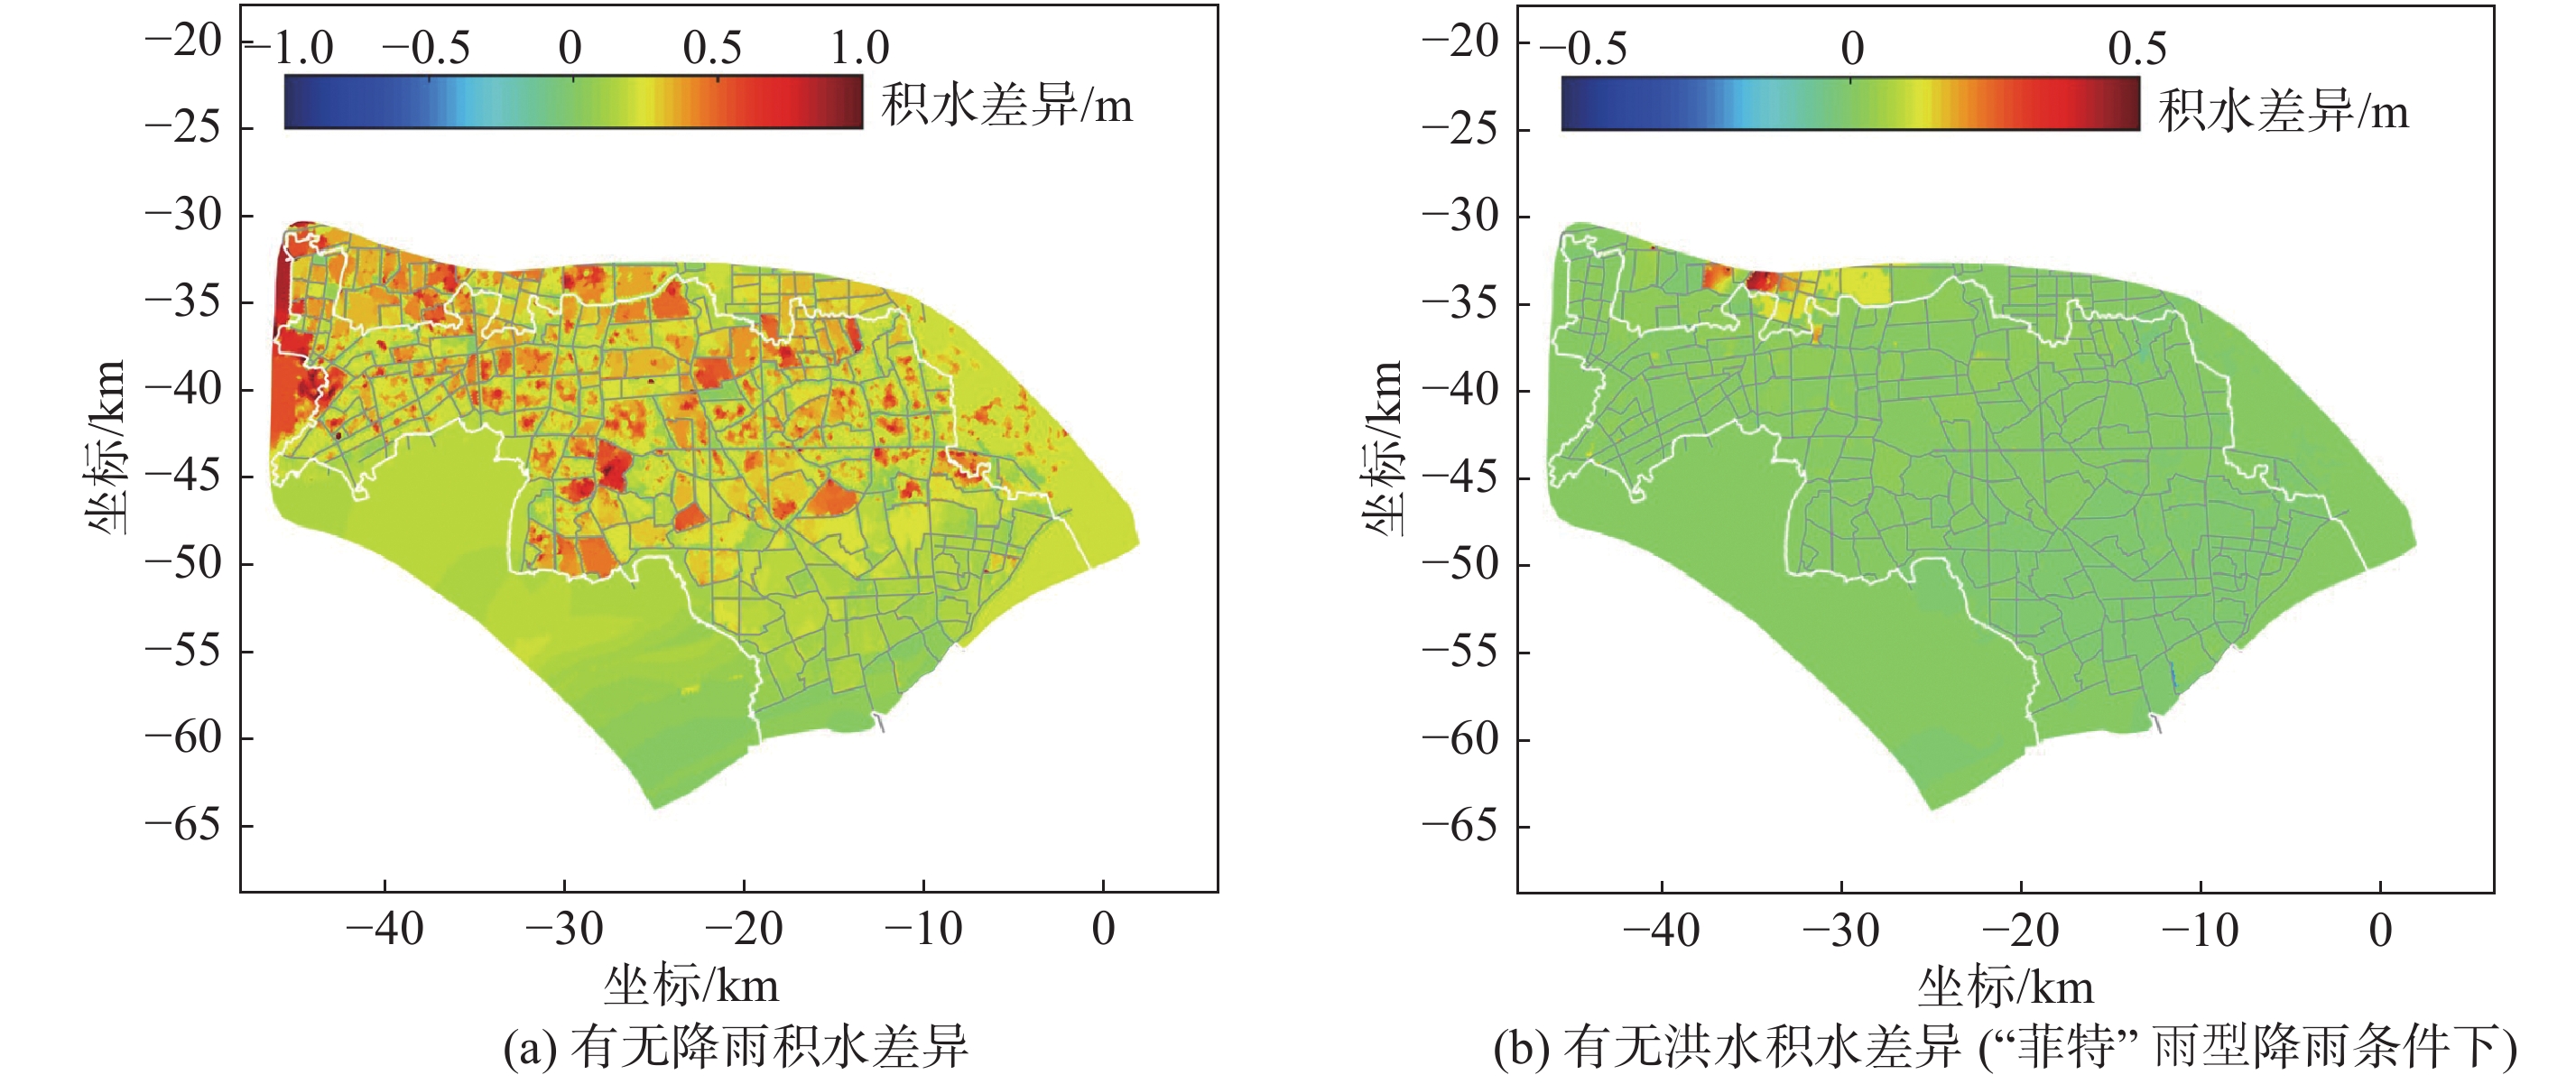
图 10 风暴潮叠加降雨或区间洪水后陆域积水差异
Fig. 10 (a) Difference in maximum waterlogging depth with precipitation included and excluded during a storm surge event (i.e., calculation condition 2 minus calculation condition 1); (b) Difference in maximum waterlogging depth with flood included and excluded during a storm surge event (calculation condition 3 minus calculation condition 2)
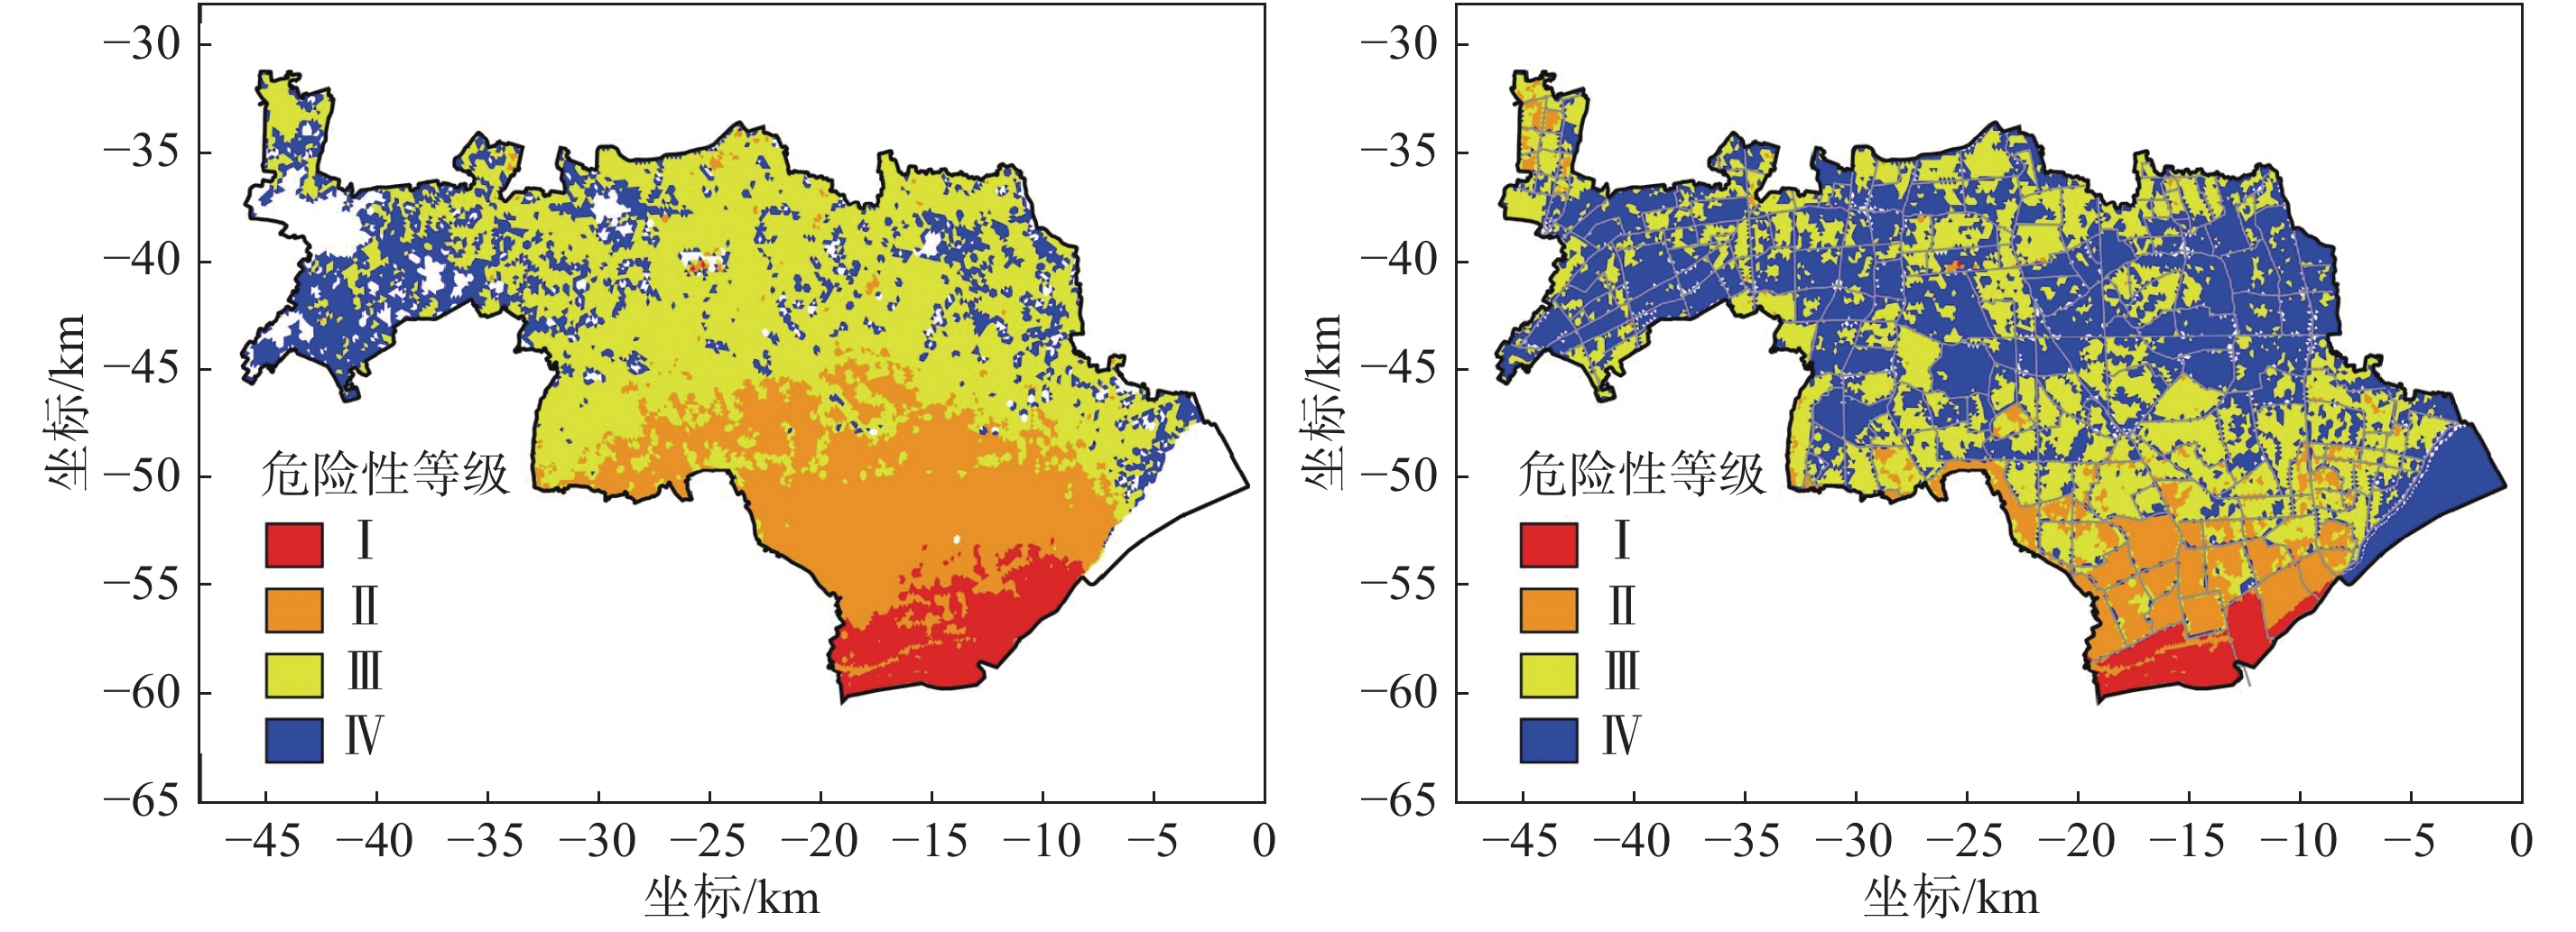
图 11 工况0(左)和工况3(右)条件下金山区危险性等级分布
Fig. 11 Risk level distribution in Jinshan District under calculation condition 0(left) and calculation condition 3 (right)

图 12 工况0和工况3条件下金山区危险性等级差异(工况3减工况0)
注: “+”为风险提高, “–”为风险降低
Fig. 12 Change in waterlogging risk level from calculation condition 0 to calculation condition 3 in Jinshan District (+ denotes rise, – denotes fall)
表 1 计算工况表
Tab. 1 Calculation conditions
计算工况 有无河道 有无降雨 有无流域洪水 工况0 无 无 无 工况1 有 无 无 工况2 有 有(“菲特”雨型) 无 工况3 有 有(“菲特”雨型) 有  下载: 导出CSV
表 2 不同计算工况下特征时刻金山区内积水量统计
Tab. 2 Statistics on water accumulation in Jinshan District at a characteristic time under different calculation conditions
计算工况 时刻 风暴潮进水量/(亿m3) 降雨产流量/(亿m3) 地表积水量/(亿m3) 河道调蓄量/(亿m3) 区域总水量/(亿m3) 工况0 150 h 2.81 2.81 2.81 240 h 2.39 2.39 2.39 工况1 140 h 2.51 1.54 0.97 2.51 240 h 2.67 1.22 1.45 2.67 工况2 140 h 2.47 1.14 2.58 1.03 3.61 240 h 2.70 1.17 2.36 1.51 3.87 工况3 140 h 2.47 1.14 2.58 1.03 3.61 240 h 2.70 1.17 2.36 1.51 3.87
下载: 导出CSV
表 3 不同工况下金山区地面最大积水面积和积水深度
Tab. 3 Maximum area and depth of waterlogging in Jinshan District under different calculation conditions
计算工况 最大积水面积/km2 平均最大积水深度/cm 最大积水深度/m 工况0 561.74 115.65 7.71 工况1 426.39 71.29 7.70 工况2 603.87 72.95 7.70 工况3 603.87 73.46 7.70
下载: 导出CSV
表 4 市(县)尺度淹没水深危险性等级划分标准
Tab. 4 Risk level of waterlogging depth at the city or county level
危险性等级 淹没水深d/cm Ⅰ d ≥ 300 Ⅱ 120 ≤ d < 300 Ⅲ 50 ≤ d < 120 Ⅳ 15 ≤ d < 50
下载: 导出CSV
表 5 不同计算工况下金山区不同危险性等级面积
Tab. 5 Waterlogging area for different risk levels in Jinshan District under calculation condition 0 and calculation condition 3
计算工况 不同危险性等级面积/km2 合计面积/km2 Ⅰ Ⅱ Ⅲ Ⅳ 工况0 35.04 144.84 275.74 95.76 551.39 工况3 17.99 66.92 226.41 281.17 592.49
下载: 导出CSV
表 6 金山区工况3较工况0危险性等级变化面积及占比
Tab. 6 Statistics on changes in risk level for waterlogging area in Jinshan District from calculation condition 0 to calculation condition 3
危险性等级差异 变化面积/km2 变化占比/% 危险性等级差异 变化面积/km2 变化占比/% +3等级 0.02 0 –1等级 243.33 40.30 +2等级 4.71 0.78 –2等级 22.27 3.69 +1等级 64.85 10.74 –3等级 0.56 0.09 0等级 268.13 44.40 合计 603.87 100
下载: 导出CSV
-
[1] 胡德宝, 龚茂珣, 孔亚珍. 强风暴潮对上海地区影响研究 [J]. 华东师范大学学报(自然科学版), 2005(5/6): 177-182. [2] 中华人民共和国自然资源部. 中国海洋灾害公报(1997—2003) [R/OL]. [2021-05-01]. http://www.mnr.gov.cn/sj/sjfw/hy/gbgg/zghyzhgb/. [3] 王军, 黄海雷, 张呈, 等. 浅谈上海应对风暴潮灾害的措施 [J]. 海洋开发与管理, 2017, 34(1): 92-96. [4] 王璐阳, 张敏, 温家洪, 等. 上海复合极端风暴洪水淹没模拟 [J]. 水科学进展, 2019, 30(4): 546-555. [5] 伍志元, 蒋昌波, 邓斌, 等. 基于海气耦合模式的南中国海北部风暴潮模拟 [J]. 科学通报, 2018, 63(33): 3494-3504. [6] 孙志林, 王辰, 钟汕虹, 等. 浪潮耦合的舟山渔港台风暴潮数值模拟 [J]. 海洋通报, 2019, 38(2): 150-158. [7] 李慧. 基于动态洪水演进模型的气候变化对沿海区影响研究 [J]. 水利水电快报, 2019, 40(4): 4. [8] 张敏, 罗军, 胡金磊, 等. 雷州市沿海风暴潮淹没危险性评估 [J]. 热带海洋学报, 2019, 38(2): 1-12. [9] 刘秋兴, 李铖. 上游洪水对台风风暴潮过程期间长江口水位的影响研究 [J]. 海洋通报, 2017, 36(2): 135-142. [10] 朱军政, 于普兵. 钱塘江河口杭州湾风暴潮溢流计算方法研究 [J]. 水科学进展, 2009, 20(2): 269-274. [11] 殷杰. 中国沿海台风风暴潮灾害风险评估研究 [D]. 上海: 华东师范大学, 2011. [12] 叶明武. 沿海台风风暴潮灾害复合情景模拟与应急避难研究——以上海为例 [D]. 上海: 华东师范大学, 2011. [13] 朱彦鋆. 基于一维二维水动力模型的上海台风风暴潮淹没情景模拟与暴露分析 [D]. 上海: 上海师范大学, 2018. [14] 陈文想. 2008—2018年强台风对珠江口—横门及其上游的增水影响分析 [J]. 广东水利水电, 2019(5): 28-31. [15] 陈长太, 祁继英. 基于SWOT的上海防洪除涝形势分析 [J]. 中国防汛抗旱, 2019, 29(6): 19-22. [16] 季永兴, 刘水芹. 平原感潮地区雨型潮型组合对除涝规模的影响 [J]. 水利水电科技进展, 2017, 37(5): 22-27. [17] 钱真, 谭琼, 贾卫红. 城市雨洪综合模拟方法及应用 [J]. 水利水电科技进展, 2015, 35(6): 57-61. [18] 顾春林, 孙永清. 杭州湾金山卫岸段减灾对策浅述 [J]. 上海水利, 1990(3): 51-54. [19] 闫白洋. 海平面上升叠加风暴潮影响下上海市社会经济脆弱性评价 [D]. 上海: 华东师范大学, 2016. [20] 上海市城乡建设和交通委员会. 滩涂促淤圈围造地工程设计规范: DGTJ08-2111—2012 [S]. 上海: 上海市城乡建设和交通委员会, 2012. [21] 上海市水务局. 2020年上海市河道(湖泊)报告 [R]. 上海: 上海市水务局, 2021. [22] 上海市水务局. 上海市治涝标准: DB31T1121—2018 [S]. 上海: 上海市水务局, 2018. [23] 上海东海海洋工程勘察设计研究院. 上海市海洋灾害风险评估与区划(金山区) [R]. 上海: 上海东海海洋工程勘察设计研究院, 2017. [24] 国家海洋局. 风暴潮灾害风险评估和区划技术导则 [S]. 北京: 国家海洋局, 2015. -

 点击查看大图

计量
- 文章访问数: 141
- HTML全文浏览量: 97
- PDF下载量: 0
- 被引次数: 0